In this post, Analysis of Accounting Ratios such as Liquidity Ratios, Profitability Ratios, Solvency Ratios, Efficiency Ratios, Market Ratios, Return on Investment Ratios, Different Ratios and their Formulas, Practice Questions for Understanding will be discussed with detail explanation.
Table of Contents
Analysis of Accounting Ratios
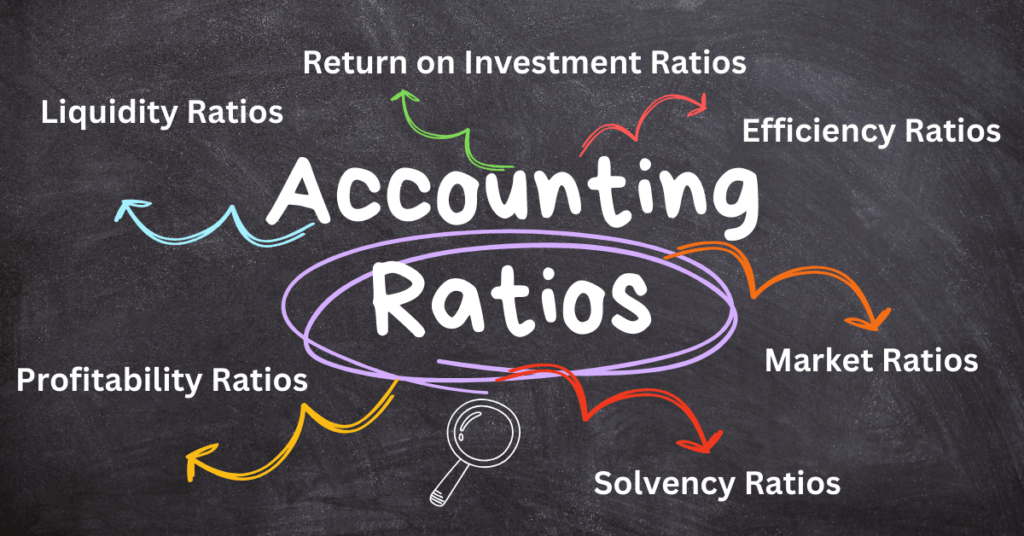
Accounting ratios serve as numerical indicators that depict the correlation between diverse financial variables and figures within a company’s financial statements. These ratios play a crucial role in scrutinizing and appraising various facets of a company’s performance, financial well-being, and effectiveness. By offering valuable insights into the operational efficiency, profitability, liquidity, solvency, and overall financial stability of a company, these ratios aid in making informed decisions. The computation of accounting ratios involves dividing one financial metric by another, typically expressed as a percentage, ratio, or fraction. These ratios are further classified into distinct types based on the financial elements they evaluate. Some commonly observed categories of accounting ratios encompass:
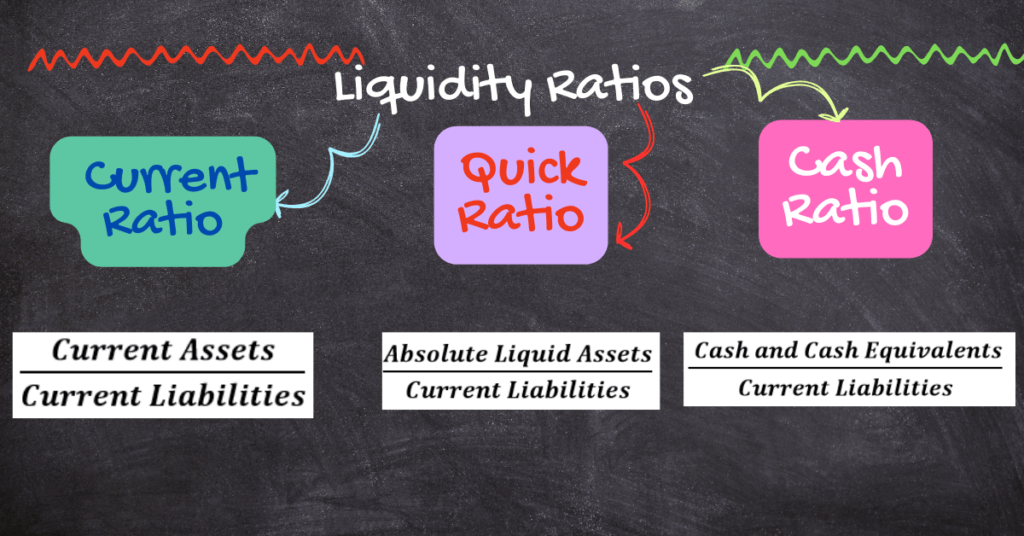
Liquidity Ratios:
Liquidity ratios serve as financial indicators that assess a firm’s capacity to fulfill its immediate financial responsibilities and promptly convert its assets into cash. These ratios offer valuable insights into the company’s short-term financial well-being and its capability to address immediate obligations. Maintaining adequate liquidity is of utmost importance for businesses as it guarantees seamless operations, timely settlement of short-term debts, and effective management of unforeseen expenditures.
There are three types of liquidity ratios:
- Current Ratio
- Quick Ratio (Acid-Test Ratio)
- Cash Ratio
Profitability Ratios:
Profitability ratios are financial indicators that measure a firm’s capacity to produce profits in relation to its expenditures and other outlays over a given timeframe. These ratios offer significant perspectives into a company’s financial performance and effectiveness. Profitability ratios are utilized by investors, creditors, and management to appraise a company’s triumph in generating profits and competently managing its resources.
Some of the commonly used profitability ratios include:
- Gross Profit Ratio
- Operating Profit Ratio
- Net Profit Ratio
- Operating Ratio
- Expense Ratio
- Return on Equity (ROE)
- Return on Assets (ROA)
Solvency Ratios:
Solvency ratios are financial indicators that evaluate a firm’s capacity to sustain its long-term financial stability and fulfill its long-term debt responsibilities. These ratios offer valuable insights into the company’s overall financial framework, leverage, and its reliance on debt for funding its business activities. For creditors and investors, solvency ratios play a vital role in assessing the level of risk associated with a company’s ability to meet its long-term financial obligations. Below are a few commonly used solvency ratios:
- Debt-to-Equity Ratio
- Interest Coverage/Debt Service Ratio
- Capital Gearing Ratio
- Debts to Total Funds/Solvency Ratio
- Reserves to Capital Ratio
- Fixed Assets Ratio
- Proprietary Ratio
Efficiency Ratios:
Efficiency ratios, also referred to as operational or activity ratios, gauge a company’s ability to utilize its resources and assets to generate income and sales. These ratios offer valuable insights into a company’s operational efficiency and effectiveness in managing its resources and assets. By examining efficiency ratios, stakeholders can evaluate a company’s capacity to optimize its inventory, working capital, and receivables, which can significantly impact its overall financial performance.
Here are some common efficiency ratios are:
- Inventory Turnover Ratio
- Inventory Conversion Period
- Receivables/Debtors Turnover Ratio
- Receivables/Debtors Collection Period
- Payables/Creditors Turnover Ratio
- Payables/Creditors Payment Period
- Working Capital Turnover Ratio
Market Ratios:
Market ratios, also referred to as valuation ratios, are financial indicators that offer valuable insights into the market’s perception of a company’s stock. These ratios play a crucial role in assisting investors and analysts in evaluating the investment appeal of a company and its relative performance within the stock market. By comparing a company’s stock price to different financial metrics, such as earnings and book value, market ratios enable the assessment of its market value and growth potential.
Here are some common market ratios are:
- Price-to-Earnings (P/E) Ratio
- Earnings per Share (EPS)
- Dividend Yield
- Price to Book (P/B) Ratio
- Market Capitalization
- Dividend Payout Ratio
Return on Investment Ratios:
Return on Investment (ROI) ratios serve as financial indicators that gauge the profitability of an investment and evaluate its performance in relation to the initial investment amount. Widely utilized by investors and analysts, ROI is expressed as a percentage and plays a crucial role in assessing the effectiveness and triumph of an investment. Diverse forms of ROI ratios exist, each designed to cater to specific contexts and provide valuable insights.
The adaptability of ROI ratios is noteworthy as they can be utilized in a multitude of investment types such as stocks, real estate, projects, and business ventures. These ratios serve as a tool for investors to evaluate the performance of their investments, compare different investment opportunities, and make informed decisions regarding capital allocation. However, it is crucial to acknowledge that ROI solely measures investment profitability and disregards the time factor and risk associated with the investment. Hence, investors should supplement ROI analysis with other metrics and consider the investment’s risk profile, holding period, and other pertinent factors for a more comprehensive assessment. Here are some ratios given below:
- Overall Profitability Ratio
- Return on Shareholder’s Fund
- Return on Gross Capital Employed
- Return on Investment ROI
Different Ratios and their Formulas
Liquidity Ratios:
Current Ratio

Quick Ratio/Absolute Liquid/ Acid-Test Ratio

Cash Ratio

Profitability Ratios:
Gross Profit Ratio

Operating Profit Ratio

Net Profit Ratio

Operating Ratio

Expense Ratio

Return on Equity (ROE)

Return on Assets (ROA)

Solvency Ratios:
Debt-to-Equity Ratio

Interest Coverage/Debt Service Ratio

Capital Gearing Ratio

Where Equity = Share Capital + Free Reserves + Profit
Where Fixed cost-bearing securities = Debentures + Long-term Loans
Debts to Total Funds/Solvency Ratio

Reserves to Capital Ratio

Fixed Assets Ratio

Proprietary Ratio

Efficiency Ratios:
Inventory/Stock Turnover Ratio

Inventory Conversion Period

Receivables/Debtors Turnover Ratio

Receivables/Debtors Collection Period

Payables/Creditors Turnover Ratio

Payables/Creditors Payment Period

Working Capital Turnover Ratio

Market Ratios:
Price-to-Earnings (P/E) Ratio

Earnings per Share (EPS)

Dividend Yield

Price to Book (P/B) Ratio

Market Capitalization

Dividend Payout Ratio

Return on Investment Ratios:
Overall Profitability Ratio

Return on Shareholder’s Fund

Return on Gross Capital Employed

Return on Investment ROI

Practice Questions for Understanding
Practice Question 1
From the following balance sheet, calculate current ratio:
| Liabilities | Rs. | Assets | Rs. |
| Equity Share Capital | 150,000 | Land & Building | 100,000 |
| Reserves & Surplus | 50,000 | Plant & Machinery | 80,000 |
| Debentures | 60,000 | Goodwill | 20,000 |
| Trade Creditors | 6000 | Cash | 5,000 |
| Bills Payable | 5000 | Investments (Short Term) | 15,000 |
| Bank Overdraft | 5000 | Bills Receivable | 5,000 |
| Outstanding expenses | 1000 | Sundry Debtors 22,000 | |
| Income Tax Payable | 3000 | Less Provision 2,000 | 20,000 |
| Proposed Dividends | 10,000 | Inventories | 30,000 |
| Work in Progress | 15,000 | ||
| 290,000 | 290,000 |
Solution:

Calculation of Current Assets & Current Liabilities
| Current Assets | Rs. | Current Liabilities | Rs. |
| Cash in hand | 5000 | Trade Creditors | 6000 |
| Stock | 30,000 | Bills Payable | 5000 |
| Investments | 15,000 | Bank Overdraft | 5000 |
| Sundry Debtors (Net) | 20,000 | Outstanding expenses | 1000 |
| Bills Receivable | 5000 | Income Tax Payable | 3000 |
| Work in Progress | 15000 | Proposed Dividends | 10,000 |
| Total | 90,000 | Total | 30,000 |
Practice Question 2
From the following balance sheet, calculate (i) Current Ratio (ii) Quick Ratio:
| Liabilities | Rs. | Assets | Rs. |
| Equity Share Capital | 200,000 | Land & Building | 80,000 |
| General Reserve | 90,000 | Machinery | 120,000 |
| Sundry Creditors | 60,000 | Cash | 10,000 |
| Bills Payable | 20,000 | Bank | 30,000 |
| Bank Overdraft | 30,000 | Stock | 140,000 |
| Provision for Tax | 5000 | Short Term Investments | 25,000 |
| Proposed Dividend | 10,000 | Sundry Debtors 40,000 | |
| Outstanding Salaries | 5000 | Less Provision 4,000 | 36,000 |
| Long Term Loans | 60,000 | Bills Receivable | 10,000 |
| Prepaid Insurance | 9,000 | ||
| Preliminary Expenses | 20,000 | ||
| 480,000 | 480,000 |
Solution:
Calculation of Current Assets & Current Liabilities
| Current Assets | Rs. | Current Liabilities | Rs. |
| Cash | 10,000 | Sundry Creditors | 60,000 |
| Bank | 30,000 | Bills Payable | 20,000 |
| Stock | 140,000 | Bank Overdraft | 30,000 |
| Short Term Investments | 25,000 | Provision for Tax | 5000 |
| Sundry Debtors 40,000 | Proposed Dividend | 10,000 | |
| Less Provision 4,000 | 36,000 | Outstanding Salaries | 5000 |
| Bills Receivable | 10,000 | ||
| Prepaid Insurance | 9,000 | ||
| Total | 260,000 | Total | 130,000 |


Quick Assets = Current Assets – (Stock + Prepaid Expenses) = 260,000 – (140,000 + 9000) = 111,000
Practice Question 3
From The following balance sheet calculate Absolute Liquid Ratio.
| Liabilities | Rs. | Assets | Rs. |
| Share Capital | 500,000 | Goodwill | 50,000 |
| Reserves | 190,000 | Plant & Machinery | 400,000 |
| Bank Overdraft | 100,000 | Trade Investments | 200,000 |
| Sundry Creditors | 140,000 | Marketable Securities | 150,000 |
| Bills Payable | 50,000 | Bills Receivable | 40,000 |
| Outstanding Expenses | 10,000 | Cash | 45,000 |
| Bank | 30,000 | ||
| Inventories | 75,000 | ||
| 9,90,000 | 9,90,000 |
Solution:

W 1: Absolute Liquid Assets = Marketable Securities + Cash in Hand + Cash at Bank = 150,000 + 45,000 + 30,000 = 225000
W 2: Calculation of Current Liabilities
| Current Liabilities | Rs. |
| Bank Overdraft | 100,000 |
| Sundry Creditors | 140,000 |
| Bills Payable | 50,000 |
| Outstanding Expenses | 10,000 |
| Total | 300,000 |
Practice Question 4
From the following balance sheet of X Ltd.; as on December 31, 2001 calculate (a) current ratio (b) acid test ratio (c) absolute liquid ratio
| Liabilities | Rs. | Assets | Rs. |
| Equity Share Capital | 10,00,000 | Cash & bank | 48600 |
| General Reserve | 100,000 | Marketable Securities | 82000 |
| Profit & Loss account | 217,000 | Stock | 272800 |
| Secured Debentures | 250,000 | Debtors | 523000 |
| Trade Creditors | 405750 | Bills Receivable | 22600 |
| Bills Payable | 18000 | Advance Tax | 100000 |
| Provision for Taxation | 264000 | Land & building | 800000 |
| Bank Overdraft | 52000 | Plant & Machinery | 544000 |
| Proposed Dividend | 86250 | ||
| 23,93,000 | 23,93,000 |
Solution:
Working 1: Current Assets & Current Liabilities
| Current Assets | Rs. | Current Liabilities | Rs. |
| Cash & bank | 48600 | Trade Creditors | 405750 |
| Marketable Securities | 82000 | Bills Payable | 18000 |
| Stock | 272800 | Provision for Taxation | 264000 |
| Debtors | 523000 | Bank Overdraft | 52000 |
| Bills Receivable | 22600 | Proposed Dividend | 86250 |
| Advance Tax | 100000 | ||
| Total | 1049,000 | Total | 8,26,000 |
Working 2: Absolute Liquid Assets
Absolute Liquid Assets = Marketable Securities + Cash & Bank =82,000 + 48600 =130,600
Working 3: Liquid Assets
Liquid Assets = Current Assets – (Stock + Prepaid Expenses)
Liquid Assets = 1049000 – (272800 + 100,000) = 676,200


For More Problems and Solutions of Accounting Ratios, Click here
You may interested n following links:
- Introduction to Statistics Basic Important Concepts
- Measures of Central Tendency, Arithmetic Mean, Median, Mode, Harmonic, Geometric Mean
- Correlation Coefficient
- How to calculate Net Present Value and Other Investment Criteria/Capital Budgeting Techniques
- Cambridge IGCSE/O Level Accounting: Topic 1: Fundamentals of Accounting & The Accounting Equation
- Cambridge IGCSE/O LEVEL Topic: 2 Sources and recording of data, Double Entry Book-keeping
- Material Costing, Specific Identification Method, Weighted Average Cost Method, First In, First Out Method(FIFO), Last In, Fist Out Method(LIFO)
- Material Costing, Economic Order Quantity EOQ, Reorder Point/Ordering Point, Lead Time, Maximum Level of Inventory, Minimum Level of Inventory, Average Stock Level, Safety Stock, Danger Level, Optimum number of Orders, Order Frequency
- Principles of Accounting, Journal, Ledger, Trial Balance
- Depreciation, Reasons of Depreciation, Methods of Depreciation, Straight Line/ Original Cost/Fixed Instalment Method, Diminishing/Declining/Reducing Balance Method.
- Consignment Account, Consignor or principal, Consignee or agent, Complete Analysis with Journal Entries, Theoretical Aspect, MCQ’s and Practical Examples