
In this blog post, I am going to discuss the paper of Business Statistics Solved Paper FBISE 2016 2nd Annual ICOM II, MCQS, Short Questions, Extensive Questions topics included are Introduction to Statistics, Averages, Index Numbers, Probability. Solved paper of Business Statistics Paper 2012 & solved paper of Business Statistics 2013, Business Statistics 2015, Business Statistics 2016 are already published on the website.
Table of Contents
Business Statistics Solved Paper FBISE 2016 2nd Annual ICOM II, MCQS, Short Questions, Extensive Questions
MCQS
| Q.1 Circle the Correct Option i.e. A/B/C/D. Each Part Carries 1 Mark. | |||||
| (i) | Group data is also called: | ||||
| A.Raw Data | B. Primary Data | C. Secondary data | D. Qualitative data | ||
| (ii) | Number of Farz in five prayers is an example of: | ||||
| A.Constant | B. Variable | C. Attribute | D. Discrete Variable | ||
| (iii) | Total of relative frequencies is equal to: | ||||
| A.0 | B. 1 | C. 10 | D. 360 | ||
| (iv) | The graph of cumulative frequency is: | ||||
| A.Ogive | B. Pie Chart | C. Histogram | D. Historigram | ||
| (v) | The sum of Squared Deviations taken from mean is: | ||||
| A.Maximum | B. Minimum | C. 0 | D. None | ||
| (vi) | For a certain distribution, if ∑(X – 5) = 0, the value of mean is: | ||||
| A.0 | B. -5 | C. 5 | D. None | ||
| (vii) | Index Number for base year is: | ||||
| A.100 | B. 0 | C. 200 | D. 10 | ||
| (viii) | Index Numbers are also called the barometers of: | ||||
| A.Statistics | B. Economics | C. Mathematics | D. None | ||
| (ix) | If P(A∩B)=0.25 and P(A) = 0.75 then P(A/B) is: | ||||
| A.1 | B. 0 | C. 1/3 | D. 3 | ||
| (x) | Probability of an impossible event is: | ||||
| A.1 | B. 0 | C. 50% | D. 1/10 | ||
Short Questions
Q.2 Attempt any eight parts. The answer to each part should not exceed 3 to 4 lines. (8 x 3 = 24)
(i) Define descriptive and inferential statistics
Answer: Descriptive statistics deals with collection and presentation of data in various forms, such as tables, graphs and diagrams and findings averages and other measures of data.
Inferential statistics deals with the testing of hypothesis and inference about population parameter is called Inferential Statistics.
(ii) Define discrete and continuous variable.
Answer: In discrete variable, data has some specific value within a given range for example 2, 4, 6, 8 or 5, 10, 15, 20 etc. In discrete variable, data is countable such as number of persons, number of cars in town etc.
Whereas in continuous variable, data has any value within a given range for example 1,3, 7, 19, 65 or 2.5, 3.9, 5.9, 7.2 etc. In continuous variable, data is measurable such as height of the persons, weight of children etc.
(iii) Define frequency distribution and size of class interval.
Answer: Frequency distribution is simply the actual occurring of a certain number of a certain number on number between ranges. Width of the class or difference of upper and lower class boundary is called class interval.
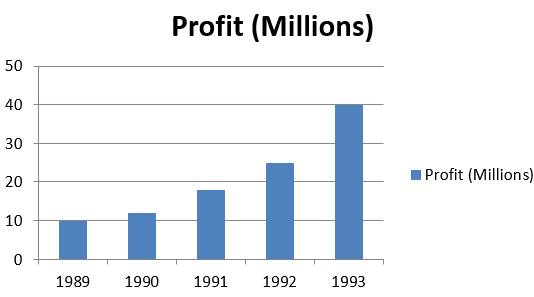
(iv) Construct a simple bar diagram for:
| Years | 1989 | 1990 | 1991 | 1992 | 1993 |
| Profit (Millions) | 10 | 12 | 18 | 25 | 40 |
Solution:
(v) The grades of a matriculation class are: Find Median grade.
| Grades | A+ | A | B | C | D |
| f | 8 | 12 | 20 | 7 | 3 |
Solution:
| Grades | f | C.F |
| A+ | 8 | 8 |
| A | 12 | 20 |
| B | 20 | 40 |
| C | 7 | 47 |
| D | 3 | 50 |
| 50 | ||
| ∑f or n = |
![\[ \mathbf{Median = \ }\frac{\mathbf{n + 1\ }}{\mathbf{2}}\mathbf{=}\frac{\mathbf{50 + 1\ }}{\mathbf{2}}\mathbf{= 25.5\ falls\ in\ cummulative\ frequency\ of\ 40\ so\ median\ is\ B}\ \]](https://bcfeducation.com/wp-content/ql-cache/quicklatex.com-4dd9c6b67a9e481aff4d007f921b2aa9_l3.png "Rendered by QuickLaTeX.com")
(vi) For 10 observations ∑(x – 23) = – 17 find X̅.
Solution:
Data
A= 23, n = 10, D = -17
![\[ \overline{\mathbf{X}}\mathbf{= A + \ }\frac{\mathbf{\sum D}}{\mathbf{n}}\mathbf{= 23 + \ }\frac{\mathbf{- 17}}{\mathbf{10}}\mathbf{= 23 - 1.7 = 21.3}\ \]](https://bcfeducation.com/wp-content/ql-cache/quicklatex.com-ac308d6b62d5038665b94579691937ad_l3.png "Rendered by QuickLaTeX.com")
(vii) Describe qualities of a good average.
Answer:
(1) It should be easy to calculate and simple to understand.
(2) It should be clearly defined by a mathematical formula.
(3) It should not be affected by extreme values.
(4) It should be based on all the observations.
(5) It should be capable of further mathematical treatment.
(6) It should have sample stability.
(viii) Define price index and a quantity index numbers.
Answer: Statistical estimator which calculates the percentage change in price with respect to time is called price index.
Statistical estimator which calculates the percentage change in quantity with respect to time is called quantity index.
(ix) Find index numbers for the following data using 1974 = 100
| Years | 1970 | 1971 | 1972 | 1973 | 1974 |
| Prices | 9 | 6 | 9 | 11 | 10 |
Solution
| Years | Prices | |
| 1970 | 9 | |
| 1971 | 6 | |
| 1972 | 9 | |
| 1973 | 11 | |
| 1974 | 10 | 100 |
![\[ \mathbf{Price\ relatives =}\frac{\mathbf{Pn}}{\mathbf{Po}}\mathbf{\ x\ 100}\ \]](https://bcfeducation.com/wp-content/ql-cache/quicklatex.com-48eab8e0f8641570fc92514335f78440_l3.png "Rendered by QuickLaTeX.com")
![\[ \frac{\mathbf{9}}{\mathbf{10}}\mathbf{\ x}\mathbf{100 = 90}\ \]](https://bcfeducation.com/wp-content/ql-cache/quicklatex.com-747545b08a3390a1f03255351d37942f_l3.png "Rendered by QuickLaTeX.com")
![\[ \frac{\mathbf{6}}{\mathbf{10}}\mathbf{\ x}\mathbf{100 = 60}\ \]](https://bcfeducation.com/wp-content/ql-cache/quicklatex.com-e6eb985d6c2f8d3c06306c31ab838cb1_l3.png "Rendered by QuickLaTeX.com")
![\[ \frac{\mathbf{6}}{\mathbf{10}}\mathbf{\ x}\mathbf{100 = 90}\ \]](https://bcfeducation.com/wp-content/ql-cache/quicklatex.com-9eb8097ff9e1af3168b78b40282d1a5c_l3.png "Rendered by QuickLaTeX.com")
![\[ \frac{\mathbf{11}}{\mathbf{10}}\mathbf{\ x100 = 110}\ \]](https://bcfeducation.com/wp-content/ql-cache/quicklatex.com-0be3223097b50d080388c7bad15b0ddd_l3.png "Rendered by QuickLaTeX.com")
Interpretation of the result
With respect to base year there is 10% reduction in price in year 1970 & 1972 and 40% reduction in 1971 whereas there is 10% inflation in 1973.
(x) A die is rolled. Find the probability that face is a complete square or it is a maximum face.
Solution:
![\[ \mathbf{Sample\ Space\ \eta}\left( \mathbf{s} \right)\mathbf{= \ }\mathbf{6}^{\mathbf{1}}\mathbf{= 6}\ \]](https://bcfeducation.com/wp-content/ql-cache/quicklatex.com-0ea916e21f0544c53dd02eee95018782_l3.png "Rendered by QuickLaTeX.com")
All possible outcomes = 1, 2, 3, 4, 5, 6
![\[ \left( \mathbf{i} \right)\mathbf{complete\ square\ 4\ or\ maximum\ 6 = \ \eta}\left( \mathbf{A} \right)\mathbf{= \ 2}\ \]](https://bcfeducation.com/wp-content/ql-cache/quicklatex.com-f8ca5ee5a2df16ce5d7a2de5ff21a12e_l3.png "Rendered by QuickLaTeX.com")
Probability
![\[ \mathbf{P}\left( \mathbf{A} \right)\mathbf{= \ }\frac{\mathbf{\eta(A)}}{\mathbf{\eta(S)}}\mathbf{=}\frac{\mathbf{2}}{\mathbf{6}}\mathbf{=}\frac{\mathbf{1}}{\mathbf{3}}\ \]](https://bcfeducation.com/wp-content/ql-cache/quicklatex.com-903d1a5e43f60a3d8fe50d82f16f62ec_l3.png "Rendered by QuickLaTeX.com")
(xi) Three coins are tossed. What is the probability that at least one head appear?
Solution:
![\[ \mathbf{Sample\ Space\ \eta}\left( \mathbf{s} \right)\mathbf{= \ }\mathbf{2}^{\mathbf{3}}\mathbf{= 8}\ \]](https://bcfeducation.com/wp-content/ql-cache/quicklatex.com-a3b91ef790124187e9da086356e3ce4f_l3.png "Rendered by QuickLaTeX.com")
All possible outcomes
| HHH | HHT | HTH | THH |
| TTT | TTH | THT | HTT |
![\[ \left( \mathbf{i} \right)\mathbf{At\ least\ one\ head = \ \eta}\left( \mathbf{A} \right)\mathbf{= \ 7}\ \]](https://bcfeducation.com/wp-content/ql-cache/quicklatex.com-84e247593d26e5bbb579aff4a2574489_l3.png "Rendered by QuickLaTeX.com")
Probability
![\[ \mathbf{P}\left( \mathbf{A} \right)\mathbf{= \ }\frac{\mathbf{\eta(A)}}{\mathbf{\eta(S)}}\mathbf{=}\frac{\mathbf{7}}{\mathbf{8}}\mathbf{= 0.875}\ \]](https://bcfeducation.com/wp-content/ql-cache/quicklatex.com-d471d09b14e0b0be647531c823d34fd4_l3.png "Rendered by QuickLaTeX.com")
Extensive Questions
Note: Attempt any two questions. All questions carry equal marks. (2×8=16)
Q.3 Find Mean, Median and Mode for the following data:
| Class Limits | 3.0—3.9 | 4.0—4.9 | 5.0—5.9 | 6.0—6.9 | 7.0—7.9 | 8.0—8.9 |
| Frequency | 13 | 27 | 40 | 30 | 16 | 4 |
Solution
| Class Limits | Frequency (f) | Class Boundaries | X | fX | C.F |
| 3.0–3.9 | 13 | 2.95–3.95 | 3.45 | 44.85 | 13 |
| 4.0–4.9 | 27 | 3.95–4.95 | 4.45 | 120.15 | 40 |
| 5.0–5.9 | 40 | 4.95–5.95 | 5.45 | 218 | 80 |
| 6.0–6.9 | 30 | 5.95–6.95 | 6.45 | 193.5 | 110 |
| 7.0–7.9 | 16 | 6.95–7.95 | 7.45 | 119.2 | 126 |
| 8.0–8.9 | 4 | 7.95–8.95 | 8.45 | 33.8 | 130 = ∑f or n |
| Sum | 130 | 729.5 | |||
| ∑f or n= | ∑fX= |
![\[ \left( \mathbf{i} \right)\mathbf{\ A.M}\overline{\mathbf{X}}\mathbf{=}\frac{\mathbf{\sum fX}}{\mathbf{\sum f}}\mathbf{=}\frac{\mathbf{729.5}}{\mathbf{130}}\mathbf{= 5.611}\ \]](https://bcfeducation.com/wp-content/ql-cache/quicklatex.com-c9de6e47bfd86768f13d4e1e41d77247_l3.png "Rendered by QuickLaTeX.com")
![\[ \left( \mathbf{ii} \right)\mathbf{\ Median = L +}\frac{\mathbf{h}}{\mathbf{f}}\mathbf{(}\frac{\mathbf{n}}{\mathbf{2}}\mathbf{- \ C)}\ \]](https://bcfeducation.com/wp-content/ql-cache/quicklatex.com-141c87ef4115d2b33fb86e9c8bc0d84a_l3.png "Rendered by QuickLaTeX.com")
Model Class = n/2 = 130/2 = 65 falls in C.f of 80 so data is:
L = 4.95, h = 1, f = 40, n/2 =130/2 = 65 & C = 40
![\[ \mathbf{Median = L +}\frac{\mathbf{h}}{\mathbf{f}}\left( \frac{\mathbf{n}}{\mathbf{2}}\mathbf{- \ C} \right)\mathbf{= \ Median = 4.95 +}\frac{\mathbf{1}}{\mathbf{40}}\left( \frac{\mathbf{130}}{\mathbf{2}}\mathbf{- \ 40} \right)\mathbf{= 4.95 +}\frac{\mathbf{25}}{\mathbf{40}}\mathbf{= 4.95 + 0.625\ }\mathbf{\ }\mathbf{\ }\ \]](https://bcfeducation.com/wp-content/ql-cache/quicklatex.com-a0286cb864ba32df34304310addea2bf_l3.png "Rendered by QuickLaTeX.com")
![\[ \mathbf{Median = 5.575}\ \]](https://bcfeducation.com/wp-content/ql-cache/quicklatex.com-44f6654202787eff6db8a05cdc8921c8_l3.png "Rendered by QuickLaTeX.com")
![\[ \left( \mathbf{iii} \right)\mathbf{\ Mode = L +}\frac{\mathbf{fm - f}\mathbf{1}}{\left( \mathbf{fm - f}\mathbf{1} \right)\mathbf{+ \ (fm - f}\mathbf{2)}}\mathbf{x\ h}\ \]](https://bcfeducation.com/wp-content/ql-cache/quicklatex.com-4b672f8ee2b999216fb2cf4868882eae_l3.png "Rendered by QuickLaTeX.com")
Model Class: Maximum frequency is 40 so data for model class is:
L = 4.95, fm = 40, f1 = 27, f2 = 30 & h = 1
![\[ \mathbf{Mode = 4.95 +}\frac{\mathbf{40 - 27}}{\left( \mathbf{40 - 27} \right)\mathbf{+ \ (40 - 30)}}\mathbf{x\ 1 = \ 4.95 +}\frac{\mathbf{13}}{\mathbf{13 + \ 10}}\mathbf{x\ 1}\ \]](https://bcfeducation.com/wp-content/ql-cache/quicklatex.com-66b88bd26c3a856dda39952567000299_l3.png "Rendered by QuickLaTeX.com")
![\[ \mathbf{Mode = 4.95 +}\frac{\mathbf{13}}{\mathbf{23}}\mathbf{x\ 1 = \ 4.95 +}\frac{\mathbf{13}}{\mathbf{23}}\mathbf{= 4.95 + 0.565 = 5.515}\ \]](https://bcfeducation.com/wp-content/ql-cache/quicklatex.com-67166a054e2156e4554f66c487c0c52b_l3.png "Rendered by QuickLaTeX.com")
Q.4 Construct the following weighted index number for 1981 on the basis of 1980:
(i) Laspeyres’s Index
(ii) Paasche’s Index
(iii) Fisher’s Ideal Index
| Commodity | Prices | Quantities | ||
| 1980 | 1981 | 1980 | 1981 | |
| A | 10 | 12 | 20 | 22 |
| B | 8 | 8 | 16 | 18 |
| C | 5 | 6 | 10 | 11 |
| D | 4 | 5 | 7 | 8 |
Solution
| Article | 1980 | 1981 | ||||||
| Price (Po) | Quantity (qo) | Price (P1) | Quantity (q1) | poqo | p1qo | p1q1 | poq1 | |
| A | 10 | 20 | 12 | 22 | 200 | 240 | 264 | 220 |
| B | 8 | 16 | 8 | 18 | 128 | 128 | 144 | 144 |
| C | 5 | 10 | 6 | 11 | 50 | 60 | 66 | 55 |
| D | 4 | 7 | 5 | 8 | 28 | 35 | 40 | 32 |
| Sum | 406 | 463 | 514 | 451 | ||||
| ∑poqo = | ∑p1qo = | ∑p1q1 = | ∑poq1 = | |||||
![\[ \mathbf{Laspeyr}\mathbf{e}^{\mathbf{'}}\mathbf{s\ Index\ 1981 =}\frac{\mathbf{\sum}\mathbf{p}_{\mathbf{1}}\mathbf{q}_{\mathbf{0}}}{\mathbf{\sum}\mathbf{p}_{\mathbf{0}}\mathbf{q}_{\mathbf{0}}}\mathbf{x\ 100}\ \]](https://bcfeducation.com/wp-content/ql-cache/quicklatex.com-4a947bc7959235d1eb049d1cbc34e2d3_l3.png "Rendered by QuickLaTeX.com")
![\[ \mathbf{Laspeyr}\mathbf{e}^{\mathbf{'}}\mathbf{s\ Index\ 1981 =}\frac{\mathbf{463}}{\mathbf{406}}\mathbf{\ x\ 100 = \ 114.03}\ \]](https://bcfeducation.com/wp-content/ql-cache/quicklatex.com-83c6f29062eef5c159affd3b2d47fac7_l3.png "Rendered by QuickLaTeX.com")
![\[ \mathbf{Paasch}\mathbf{e}^{\mathbf{'}}\mathbf{s\ Index\ 1981 =}\frac{\mathbf{\sum}\mathbf{p}_{\mathbf{1}}\mathbf{q}_{\mathbf{1}}}{\mathbf{\sum}\mathbf{p}_{\mathbf{0}}\mathbf{q}_{\mathbf{1}}}\mathbf{x\ 100}\ \]](https://bcfeducation.com/wp-content/ql-cache/quicklatex.com-1ef921b31e5723cd17ef01c44da733c5_l3.png "Rendered by QuickLaTeX.com")
![\[ \mathbf{Paasch}\mathbf{e}^{\mathbf{'}}\mathbf{s\ Index\ 1981 =}\frac{\mathbf{514}}{\mathbf{451}}\mathbf{x\ 100 = 113.96}\ \]](https://bcfeducation.com/wp-content/ql-cache/quicklatex.com-3c79ef1d8a6e6b578294091456210864_l3.png "Rendered by QuickLaTeX.com")
![\[ \mathbf{Fishe}\mathbf{r}^{\mathbf{'}}\mathbf{s\ Ideal\ Index\ 1981 =}\sqrt{\mathbf{LxP}}\ \]](https://bcfeducation.com/wp-content/ql-cache/quicklatex.com-6ce738abf23fafb2068b1330fdbb19c9_l3.png "Rendered by QuickLaTeX.com")
![\[ \mathbf{Fishe}\mathbf{r}^{\mathbf{'}}\mathbf{s\ Ideal\ Index\ 1981 =}\sqrt{\mathbf{114.03}\mathbf{x}\mathbf{113.96}}\ \]](https://bcfeducation.com/wp-content/ql-cache/quicklatex.com-10dcee05591723516ddc1d195ab6e334_l3.png "Rendered by QuickLaTeX.com")
![\[ \mathbf{Fishe}\mathbf{r}^{\mathbf{'}}\mathbf{s\ Ideal\ Index\ 1981 = 113.99}\ \]](https://bcfeducation.com/wp-content/ql-cache/quicklatex.com-aa9a1b5a61d630f3d4a3e1c148a7929c_l3.png "Rendered by QuickLaTeX.com")
Q.5 Two balls are selected at random from a bag containing 4 white and 2 black balls. Find the probability that:
(i) Both balls are white (ii) Both are of same colour (iii) Both are the different colour
Solution
White Balls = 4, Black Balls = 2, N = 4+2 = 6, r = 2
Sample Space
![\[ \mathbf{\eta}\left( \mathbf{s} \right)\mathbf{= \ }\begin{bmatrix}\mathbf{N} \\\mathbf{C}\\\mathbf{r}\\\end{bmatrix}\mathbf{=}\begin{bmatrix}\mathbf{6} \\\mathbf{C} \\\mathbf{2} \\\end{bmatrix}\mathbf{= 15}\ \]](https://bcfeducation.com/wp-content/ql-cache/quicklatex.com-f91f067943a52ceae83500f05edb58ce_l3.png "Rendered by QuickLaTeX.com")
(i) Probability that Both Balls are White
![\[ \textbf{P(Both White Balls)} = \frac{\begin{pmatrix}\mathbf{4} \\\mathbf{2} \\\end{pmatrix}\begin{pmatrix}\mathbf{2} \\\mathbf{0} \\\end{pmatrix}}{\begin{pmatrix}\mathbf{6} \\\mathbf{2} \\\end{pmatrix}}\mathbf{= \ }\frac{\mathbf{6}\mathbf{x}\mathbf{1}}{\mathbf{15}}\mathbf{=}\frac{\mathbf{6}}{\mathbf{15}}\mathbf{= 0.4}\ \]](https://bcfeducation.com/wp-content/ql-cache/quicklatex.com-d729cfaf0e52c18de7fd78e0c29c02d5_l3.png "Rendered by QuickLaTeX.com")
(ii) Both are of same colour
If both have white color then probability is same as above 0.4. Probability of both black is calculated below:
![\[ \textbf{P(Both Black) =} \frac{\begin{pmatrix}\mathbf{4} \\\mathbf{0} \\\end{pmatrix}\begin{pmatrix}\mathbf{2} \\\mathbf{2} \\\end{pmatrix}}{\begin{pmatrix}\mathbf{6} \\\mathbf{2} \\\end{pmatrix}}\mathbf{= \ }\frac{\mathbf{1}\mathbf{x}\mathbf{1}}{\mathbf{15}}\mathbf{=}\frac{\mathbf{1}}{\mathbf{15}}\mathbf{= 0.067}\ \]](https://bcfeducation.com/wp-content/ql-cache/quicklatex.com-8f4e961e282b47b00bef7f138fd67a61_l3.png "Rendered by QuickLaTeX.com")
(iii) Both are the different colour
![\[ \textbf{P(Both are of different color) =} \frac{\begin{pmatrix}\mathbf{4} \\\mathbf{1} \\\end{pmatrix}\begin{pmatrix}\mathbf{2} \\\mathbf{1} \\\end{pmatrix}}{\begin{pmatrix}\mathbf{6} \\\mathbf{2} \\\end{pmatrix}}\mathbf{= \ }\frac{\mathbf{4}\mathbf{x}\mathbf{2}}{\mathbf{15}}\mathbf{=}\frac{\mathbf{8}}{\mathbf{15}}\mathbf{= 0.54}\ \]](https://bcfeducation.com/wp-content/ql-cache/quicklatex.com-10e67c81ddd40853444ead400824ec55_l3.png "Rendered by QuickLaTeX.com")
You may also interested in the following:
Business Statistics Solved Paper FBISE 2012 ICOM II, MCQS, Short Questions, Extensive Questions
Business Statistics Solved Paper FBISE 2013 ICOM II, MCQS, Short Questions, Extensive Questions
Business Statistics Solved Paper FBISE 2015 ICOM II, MCQS, Short Questions, Extensive Questions
Business Statistics Solved Paper FBISE 2016 ICOM II, MCQS, Short Questions, Extensive Questions
Introduction to Statistics Basic Important Concepts
Measures of Central Tendency, Arithmetic Mean, Median, Mode, Harmonic, Geometric Mean


