Business Statistics Solved Past Paper 2019 ICOM Part 2 BISERWP. Preparing for your ICOM Part 2 Business Statistics exam under the Board of Intermediate and Secondary Education, Rawalpindi (BISE RWP)? Look no further. In this post, we provide a complete, step-by-step solution to the Business Statistics Solved Past Paper 2019 – designed specifically for ICOM Part 2 students.
From index numbers, measures of central tendency, and probability to time series analysis and correlation, every question is broken down with clear formulas, working, and final answers. Whether you’re revising key concepts or practicing for better speed and accuracy, this solved paper acts as your personal tutor. Download it, practice along, and boost your confidence for the upcoming BISE Rawalpindi exams. For more solved papers, click here!
Table of Contents
Business Statistics Solved Past Paper 2019 ICOM Part 2 BISERWP
Q.1 MCQS
| 1. In chain base method, the base period is: | |||||||
| A | Fixed | B | Not-fixed | C | Constant | D | Zero |
| 2. Which of the following formula is used for link relative? | |||||||
| A | (Pn/Pn)x100 | B | (Pn/Po)x100 | C | (Pn-1/Pn)x100 | D | (Pn/Pn-1)x100 |
| 3. 6C3 = _________. | |||||||
| A | 6 | B | -15 | C | 20 | D | 25 |
| 4. When two dice are rolled the possible outcomes are: | |||||||
| A | 6 | B | 12 | C | 24 | D | 36 |
| 5. Parameters are related to: | |||||||
| A | Sample | B | Population | C | Mean | D | Median |
| 6. A variable which can take all possible values in an interval is called: | |||||||
| A | Continuous variable | B | Discrete variable | C | Qualitative variable | D | Finite variable |
| 7. Total angles of the pie-chart are: | |||||||
| A | 270° | B | 300° | C | 320° | D | 360° |
| 8. The graph of frequency distribution is called: | |||||||
| A | Historigram | B | Pie-chart | C | Histogram | D | Ogive |
| 9. The mode for the values 4, 4, 5, 6, 3, 3, 2 is: | |||||||
| A | 2 | B | 4 | C | 3 | D | 3 and 4 |
| 10. Sum of the deviations from mean is: | |||||||
| A | = zero | B | <0 (less) | C | >0 (greater) | D | one |
2. Write short answers of any six parts from the following.
i. What is parameter?
Answer: A measure computed from a population data is called parameter. For example, a population mean is a parameter. Mean of population µ is a parameter.
ii. Define variable.
Answer:
A measurable quantity which can vary (differ) from one individual to another or one object to another object is called variable. For e.g. height of students, weight of children. It is denoted by the letters of alphabet e.g. x, y, z etc.
iii. What is data?
Answer: A set of values or number of values collected during research survey is called data. For example, data related to incomes or savings of citizens.
iv. Explain quantitative variable.
Answer: A characteristics expressed by mean of quantitative terms is known as quantitative variable. For e.g. number of deaths in a country per year, prices temperature readings, heights, weights etc.
v. Describe the frequency distribution.
Answer: A frequency distribution is a way to organize raw data into a table. It shows how many times (frequency) each value or group of values occurs in the data.
vi. What do you mean by mid-point or class mark?
Answer: The midpoint of a class interval in a frequency distribution, calculated as the average of the lower and upper boundaries of the interval. It represents the central value of the class. It is denoted by (X)
Formula:
vii. Explain the term tabulation.
Answer: Tabulation is the process of arranging data in the form of rows and columns (a table). It makes data easy to read, compare, and understand.
viii. What is the historigram?
Answer: Historigram is a type of chart which is used to present the data of time series in which different variations of time series can be shown.It is also called graph of time series or historical series. In historigram, time is taken on x-axis and variable is taken on y-axis.
ix. Describe the advantages of diagram.
Answer: A diagram (like a bar chart, pie chart, or line graph) is a picture of the data. Its advantages are:
Easy to understand – Even a common person can understand a diagram without studying statistics.
Attractive and eye-catching – Pictures grab attention better than numbers.
Quick comparison – You can compare two or more values at a single glance.
Shows trends clearly – For example, a line graph easily shows if sales are increasing or decreasing.
3. Write short answers of any six parts from the following.
i. What is an average?
Answer: Average refers to the sum of numbers divided by n. it is also called the mean average or Central tendency or a measure of the middle value of the data set.
ii. Give two properties of arithmetic mean.
Answer:
- The sum of the deviations, of all the values of x, from their arithmetic mean, is zero i.e.
For Ungrouped Data
For Grouped Data
- Sum of squares of deviations from arithmetic mean is least i.e.
For Ungrouped Data
For Grouped Data
iii. Find median of the values 5, 10, 13, 15, 12, 7, 9.
Solution:
| S/No | 1 | 2 | 3 | 4 | 5 | 6 | 7 |
| Arranged X | 5 | 7 | 9 | 10 | 12 | 13 | 15 |
iv. Give two demerits of mode.
Answer:
- It is not well defined.
- It is not based on all the values.
- It is stable for large values and it will not be well defined if the data consists of small number of values.
- It is not capable of further mathematical treatment.
v. Define composite index number.
Answer: In composite index numbers, prices or quantities are related to more than one product. Composite index number is further classified as weighted and unweighted index numbers. In weighted index, quantities and prices are both given whereas in unweighted index, only prices are given.
vi. Define sample space.
Answer: All possible outcomes of a random experiment are called sample space. It is denoted by η(S). For example, in case of tossing a coin, the sample space will be 2 and in case of throwing a die, the sample space will be 6.
vii. Define permutation.
Answer: A permutation is an arrangement of all or part of a set of objects where order matters. If you have objects and you arrange them in different ways, each different arrangement is called a permutation.
viii. Make sample space when two coins are tossed.
Answer:
All Possible Outcomes or Sample Points
| H,H | H,T | T,H | T,T |
ix. Given that ∑poqo=1500, ∑p1qo=2400. Find Laspeyres’s Price index number.
Solution:
4. (a) The weights of 30 college students are given below.
| 130 | 133 | 124 | 121 | 115 | 139 | 137 | 144 | 142 | 133 |
| 133 | 128 | 129 | 132 | 131 | 128 | 126 | 132 | 134 | 135 |
| 138 | 130 | 141 | 136 | 135 | 141 | 123 | 126 | 118 | 134 |
Prepare a frequency distribution taking a class interval of size 5 (115-119, 120-124, …).
Solution:
| Class Interval | Frequency |
| 115 – 119 | 2 |
| 120 – 124 | 3 |
| 125 – 129 | 5 |
| 130 – 134 | 8 |
| 135 – 139 | 6 |
| 140 – 144 | 6 |
| Total | 30 |
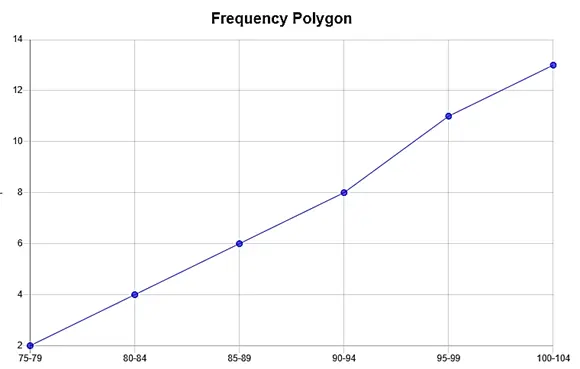
(b) Daily wages of factory workers are given below. Draw cumulative frequency Polygon or Ogive.
| Wages | 75-79 | 80-84 | 85-89 | 90-94 | 95-99 | 100-104 |
| f | 2 | 4 | 6 | 8 | 11 | 13 |
Solution
5. (a) For the given ungrouped data calculate the mean. Data = 2, 5, 7, 9, 12, 6, 3, 5, 3, 11, 15, 16, 17, 20, 25, 23.
Solution:
| X | 2 | 5 | 7 | 9 | 12 | 6 | 3 | 5 | 3 | 11 | 15 | 16 | 17 | 20 | 25 | 23 | ∑X = 179 |
(b) Find the median from the following.
| C.Limit | 60-62 | 62-64 | 64-66 | 66-68 | 68-70 |
| F | 5 | 18 | 42 | 27 | 8 |
Solution:
| C. Limit | F | X | C.F |
| 60-62 | 5 | 61 | 5 |
| 62-64 | 18 | 63 | 23 |
| 64-66 | 42 | 65 | 65 |
| 66-68 | 27 | 67 | 92 |
| 68-70 | 8 | 69 | 100 |
| ∑f=n=100 |
n/2 = 100/2 = 50 falls in C.F range of 23-65 so l = 64, h = 2, f = 42, c = 23
6. (a) Calculate index number for years 2006, 2007, 2008 by taking 2005 as base.
| Year | Wheat | Rice | Cotton |
| 2005 | 12 | 3.00 | 4.20 |
| 2006 | 12.50 | 3.25 | 4.90 |
| 2007 | 13.50 | 3.50 | 5.25 |
| 2008 | 15.00 | 3.75 | 5.60 |
Solution:
| Year | Wheat | P.R | Rice | P.R | Cotton | P.R | A.M |
| 2005 | 12 | (12/12)100= 100 | 3.00 | (3/3)100= 100 | 4.20 | (4.20/4.20)100= 100 | 100 |
| 2006 | 12.50 | (12.50/12)100=104.16 | 3.25 | (3.25/3)100=108.33 | 4.90 | (4.90/4.20)100=116.66 | 329.15/3 =109.71 |
| 2007 | 13.50 | (13.50/12)100=112.5 | 3.50 | (3.50/3)100=116.66 | 5.25 | (5.25/4.20)100=125 | 354.16/3 = 118.05 |
| 2008 | 15.00 | (15/12)100=125 | 3.75 | (3.75/3)100=125 | 5.60 | (5.60/4.20)100=133.33 | 383.33/3 =127.77 |
(b) Three coins are tossed. What is the probability of getting? (i) No head (ii) At least 3 head
Solution:
All Possible Outcomes or Sample Points
| H,H,H | H,H,T | H,T,H | T,H,H |
| T,T,T | T,T,H | T,H,T | H,T,T |
Events
Probability


