Looking to ace your exams? We’ve got you covered. This post provides the complete, step-by-step solution for the Business Statistics Solved Past Paper 2021 ICOM Part 2 BISERWP specifically tailored for ICOM Part 2 students under the Board of Intermediate and Secondary Education Rawalpindi (BISERWP).
Whether you are struggling with the complexities of Index Numbers, searching for clarity on Measures of Central Tendency, or need to perfect your Probability calculations, our detailed guide breaks down every problem from the 2021 annual examination.
Why Use This Solved Paper?
- Accuracy: Every calculation is verified to ensure you learn the correct methodology.
- Step-by-Step Methodology: We don’t just give you the answer; we show you how to get there using the formulas approved by the Rawalpindi Board.
- Exam Ready: Understand the paper pattern and weightage of different chapters to prioritize your study time effectively.
Success Tip: Practicing past papers is the most effective way to reduce exam anxiety and improve your time management skills.
Download the full PDF or view the detailed solutions below to ensure you’re fully prepared to score maximum marks in your upcoming board exams. For more commerce resources, past papers, and educational updates, keep visiting bcfeducation.com.
Table of Contents
Business Statistics Solved Past Paper 2021 ICOM Part 2 BISERWP
Q.1 MCQS
| Q# | Question | A | B | C | D |
| 1 | When a pair of dice is rolled the sample space consists of sample points: | 6 | 12 | 24 | 36 |
| 2 | When two coins are tossed simultaneously, the probability of one head is: | 1/4 | 1/8 | 1/2 | 1/5 |
| 3 | Data classified by attributes is called: | Qualitative | Quantitative | Discrete | Continuous |
| 4 | The grouped data is also called: | Raw data | Primary Data | Secondary Data | Qualitative Data |
| 5 | Systematic arrangement of data in rows and columns is called: | Classification | Tabulation | Stub | Box Head |
| 6 | Frequency is denoted by: | C | f | q | r |
| 7 | Mean of symmetrical distribution is 90, value of its median will be: | 80 | 85 | 90 | 75 |
| 8 | Arithmetic mean of two numbers a and b is: | ab/2 | 2a/b | (a+b)/2 | 2/(a+b) |
| 9 | Link relatives can be obtained dividing Pn by: | q (n-1) | Po | qo | P (n-1) |
| 10 | An index number is called simple index if computed for: | Single Variable | Two Variables | Multiple Variables | None of these |
Our comprehensive guide on the Business Statistics Solved Past Paper 2021 ICOM Part 2 BISERWP ensures you grasp key concepts effectively.
SECTION-I
Q.2 Write short answers to any SIX (6) questions. (6 x 2 = 12)
i. Define inferential statistics.
Answer:
It is the branch of statistics, which deals with the testing of hypothesis and inference about population parameter is called Inferential Statistics.
ii. Define qualitative variable.
Answer:
When a characteristic is express by mean of qualitative term is known as qualitative variable or an attributes. For e.g. smoking, beauty, educational status, green, blues etc. it is noted that these characters cannot measure numerically.
iii.Differentiate between statistic and parameter.
Answer:
Statistic
A measure computed from a sample data is called statistic. For example, sample mean is a statistic. Mean of a sample X̅ is a statistic.
Parameter
A measure computed from a population data is called parameter. For example, a population mean is a parameter. Mean of population µ is a parameter.
iv.What is the average?
Answer:
In average, we calculate the most central point of the data. Measures of Central Tendency represents five different types of averages such as, mean, median, mode, harmonic, and geometric mean. With the help of average, we can observe the central trend of the data. It is a part of descriptive statistics.
v.Define mode.
Answer:
Mode is a type of average. In ungroup data it is most repeated value. It calculates the central point of the data. It is an important average used in forestry department. Its symbol is “X̂”. Its formulas are given below:
Ungrouped Data
X̂ = Most repeated value
Grouped Data
vi. Write two properties of A.M.
Answer:
- The sum of the deviations, of all the values of x, from their arithmetic mean, is zero i.e.
For Ungrouped Data
For Grouped Data
- Sum of squares of deviations from arithmetic mean is least i.e.
For Ungrouped Data
For Grouped Data
- If mean of variable X is X̅ and X &Y are linearly related as Ŷ =a+bX then Y̅ =a+bX̅ Where a and b are known constants.
vii. If median = 40 and mode = 50. Find mean.
Solution:
Mode=3median-2mean
50=3(40) – 2mean
50 = 120 – 2mean
Mean = 70/2
Mean = 35
viii. Find median of 10, 4, 8, 13.
Solution:
| S/No | 1 | 2 | 3 | 4 |
| Arranged X | 4 | 8 | 10 | 13 |
Median=Value of 2.5th item.
Median=2nd Value+0.5(3rd-2nd Value)
Median = 8 + 0.5 (10-8)
Median = 8 + 1
Median = 9
ix. Write two demerits of median.
Answer:
Demerits of median
- It ignores extreme values.
- All the values do not take a part in calculation of median.
- It can be rarely used in further calculation.
Q.3 Write short answers to any Six (6) questions: (6 x 2 = 12)
i. Define Simple bar chart.
Answer:
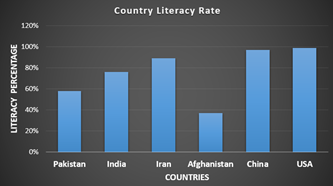
A simple rectangular bar chart is a graphical representation of data using rectangular bars, where the length or height of each bar corresponds to the value it represents. It is commonly used to compare categories or track changes over time. Example of rectangular Bar Chart is given below:
| Country | Literacy Rate |
| Pakistan | 58% |
| India | 76% |
| Iran | 89% |
| Afghanistan | 37% |
| China | 97% |
| USA | 99% |
ii. What is classification?
Answer:
The process of classifying data into groups is called classification whereas to present data in the form of table or to present into rows and columns is called tabulation.
iii. What is an array?
Answer:
An array is a systematic arrangement of data in a specific order, usually either ascending (smallest to largest) or descending (largest to smallest).
Simple Definition:
An array is the process of organizing raw data into a meaningful sequence.
Example:
Raw data: 10, 5, 11, 4, 15
Array (ascending): 4, 5, 10, 11, 15
Array (descending): 15, 11, 10, 5, 4
iv. Define Price index number.
Answer:
A price index measures how much prices have increased or decreased compared to a base period.
- It is used to measure inflation or deflation
- It compares current prices with base year prices
- Common examples include:
Consumer Price Index (CPI)
Wholesale Price Index (WPI)
Example:
If the price index was 100 in the base year and becomes 130 in the current year, it means:
Prices have increased by 30%
v. What is Laspeyre’s index number?
Answer:
Laspeyre’s Index is an index in which we calculate the relative change in the price with respect to base period price. It is a type of weighted index in which quantities consumed are also taken into account. It is also called base year weighted index. Its formula is given below:
vi. Define Probability.
Answer:
Probability is a statistical measure to calculate the chance of happening something or not happening something or we can say that it is a measure of uncertainty or likelihood. Probability always ranges between 0 to 1 both inclusive. Zero indicates the impossibility of the event and 1 indicates the strong and absolute certainty of the event.
vii. Define a sure event. Give one example.
Answer:
A sure event (also called a certain event) is an event that always occurs in an experiment.
Simple Definition:
A sure event is an event whose probability is equal to 1.
Example:
When rolling a die:
Event: “Getting a number less than 7”
Since all possible outcomes (1, 2, 3, 4, 5, 6) satisfy this condition, it is a sure event.
viii. What is Sample space?
Answer:
All possible outcomes of a random experiment are called sample space. It is denoted by η(S). For example, in case of tossing a coin, the sample space will be 2 and in case of throwing a die, the sample space will be 6.
ix.If Laspeyre’s index number is 101.69 and Fisher’s index number is 90.80, then find Paasche’s index number.
Solution:
Taking square root on both sides:
Paasche’ s Index=81.07
SECTION-II
Note: Attempt any two questions from the following.
Q.4 (a) Make a discrete frequency distribution from the observations, taking one as size of class interval. (4)
| 5 | 9 | 2 | 0 | 1 | 3 | 5 | 7 | 8 | 6 |
| 4 | 3 | 1 | 3 | 2 | 3 | 4 | 3 | 2 | 5 |
| 6 | 4 | 5 | 5 | 3 | 2 | 3 | 5 | 10 | 5 |
Solution:
| Value (x) | Frequency (f) |
| 0 | 1 |
| 1 | 2 |
| 2 | 4 |
| 3 | 7 |
| 4 | 3 |
| 5 | 7 |
| 6 | 2 |
| 7 | 1 |
| 8 | 1 |
| 9 | 1 |
| 10 | 1 |
| ∑f = 30 |
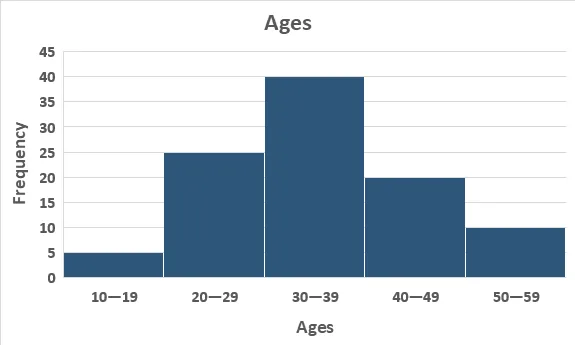
(b) Draw the Histogram from the following data: (4)
| Ages | 10—19 | 20—29 | 30—39 | 40—49 | 50—59 |
| Frequency | 5 | 25 | 40 | 20 | 10 |
Solution:
Q.5 (a) Calculate the Arithmetic Mean of the following frequency distribution. (4)
| X | 12 | 14 | 16 | 18 | 20 | 22 |
| f | 01 | 04 | 06 | 10 | 07 | 02 |
Solution:
| X | f | fx |
| 12 | 1 | 12 |
| 14 | 4 | 56 |
| 16 | 6 | 96 |
| 18 | 10 | 180 |
| 20 | 7 | 140 |
| 22 | 2 | 44 |
| ∑f = 30 | ∑fx = 528 |
(b) Compute median for the following data. (4)
| Marks | 0—10 | 10—20 | 20—30 | 30—40 | 40—50 | 50—60 |
| Frequency | 3 | 9 | 15 | 30 | 18 | 5 |
Solution:
| Marks | Frequency | X | C.F |
| 0—10 | 3 | 5 | 3 |
| 10—20 | 9 | 15 | 12 |
| 20—30 | 15 | 25 | 27 |
| 30—40 | 30 | 35 | 57 |
| 40—50 | 18 | 45 | 75 |
| 50—60 | 5 | 55 | 80 |
| ∑f = n = 80 |
n/2 = 80/2 = 40 falls in C.F range of 27-57 so l = 30, h = 10, f = 30, c = 27
Q.6 (a) Find the price index with 1981 as base using simple average of relative method: (4)
| Year | Price | ||
| A | B | C | |
| 1981 | 18 | 85 | 52 |
| 1982 | 22 | 76 | 60 |
| 1983 | 28 | 80 | 56 |
Solution:
| Year | Price | Price Relatives | Average | ||||
| A | B | C | P.R A | P.R A | P.R A | Median | |
| 1981 | 18 | 85 | 52 | 100 | 100 | 100 | 100 |
| 1982 | 22 | 76 | 60 | (22/18)100 =122.2 | (76/85)100 =89.41 | (60/52)100 =115.38 | 115.38 |
| 1983 | 28 | 80 | 56 | (28/18)100 =155.5 | (80/85)100 =94.11 | (56/52)100 =107.69 | 107.69 |
(b) A Coin is tossed thrice. Find the probability: (i) No head, (ii) Two heads. (4)
Solution:
All Possible Outcomes or Sample Points
| H,H,H | H,H,T | H,T,H | T,H,H |
| T,T,T | T,T,H | T,H,T | H,T,T |
Events
Probability


