
Business Statistics Solved Paper 2024 Lahore Board (BISE Lahore) – Complete Solution. Get the complete solution of the Business Statistics Lahore Board 2024 paper. Step-by-step solved questions, easy explanations, and exam preparation guide for students.
This post provides a complete and detailed solution to the Business Statistics 2024 paper of the Lahore Board (BISE Lahore). All questions are solved step by step with clear explanations to help students understand key concepts such as measures of central tendency, dispersion, probability, and data analysis. This solved paper is highly useful for I.Com and business students preparing for exams, helping them practice past paper questions and improve their problem-solving skills. For more solutions, stay in touch with bcfeducation.com
Table of Contents
Business Statistics Solved Paper 2024 Lahore Board (BISE Lahore) – Complete Solution
MCQS
| Q# | Question | A | B | C | D |
| 1 | Battery life time is variable: | Qualitative | Discrete | Comparable | Continuous |
| 2 | Graph of class boundaries and frequency is: | Histogram | Ogive | Histogriam | Bar chart |
| 3 | One dimensional diagram is: | Rectangular diagram | Square diagram | Simple bar chart | Pie diagram |
| 4 | Single value which represent a set of data: | Symmetric | Central tendency | Skew-symmetric | Quartile |
| 5 | If Σx = 150, X̄ = 10 then n = | 10 | 50 | 5 | 15 |
| 6 | Mode of 2, 7, 10, 15 is: | Zero | No mode | 2 | 15 |
| 7 | The year for which index number is 100 known as: | Current year | Previous year | Chain year | Base year |
| 8 | Consumer price index number is also called: | Value | Volume | Cost of living index | Wholesale price |
| 9 | Probability of getting red card when a card is drawn from 52: | 1/26 | 1/54 | 26/52 | 1/2 |
| 10 | If P(A∩B) = P(A) then A and B are: | Independent | Dependent | Mutually exclusive | Exhaustive |
Q.2 Write short answers to any SIX (6) questions. Marks (6 x 2=12)
i. Define parameter by giving an example.
Answer: A measure computed from a population data is called parameter. For example, a population mean is a parameter. Mean of population µ is a parameter.
ii. Explain the concept of primary data.
Answer: Most original first hand collected data is called primary data or the data without any statistical analysis is called primary data.
iii. Differentiate ungrouped and grouped data.
Answer:
Primary/Ungrouped Data
Most original first hand collected data is called primary/ungrouped data or the data without any statistical analysis is called primary data.
Secondary/Grouped Data
The data which has already collected and statistically analyzed by someone is called secondary/grouped data. The data given in your book and all grouped data is called secondary data.
iv. Define Statistics in Plural Sense.
Answer: In plural sense “Statistics” refers to data collected in systematic manner for definite purpose in any field of study i.e. industrial production, population growth of country etc.
v. Distinguish between histogram and historigram.
Answer:
Histogram
A Histogram is a graphical representation of data using bars to show the frequency distribution of continuous data. Unlike a bar graph, the bars in a histogram touch each other, representing intervals (bins) of data values. It is used to analyze the shape, spread, and central tendency of data.
Historigram
Historigram is a type of chart which is used to present the data of time series in which different variations of time series can be shown.It is also called graph of time series or historical series. In historigram, time is taken on x-axis and variable is taken on y-axis.
vi. What is an array?
Answer: An array is a simple way of arranging data in a systematic order or a set of data arranged in ascending or descending order of magnitude.
vii. Explain the term “Equally Likely Events”.
Answer: If two events A and B have equal chance to happen or occur then the events are called equally likely events. For example, in case of tossing a coin, head has equal chance to appear as tail similarly in case of throwing a die, even number has equal chance as the odd number.
viii. Write down sample space when three coins are tossed.
Solution:
All Possible Outcomes
| H,H,H | H,H,T | H,T,H | T,H,H |
| T,T,T | T,T,H | T,H,T | H,T,T |
ix. A die is rolled. What is the probability that it shows odd numbers?
Solution:
All Possible Outcomes or Sample Points
{1, 2, 3, 4, 5, 6}
Events
Probability
Q.3 Write short answers to any Six (6) questions: Marks (6 x 2=12)
i. Given D = X – 2075, ΣfD = 10730, Σf = 500, find arithmetic mean.
Solution:
ii. Describe four desirable qualities of a good average.
Answer:
(1) It should be easy to calculate and simple to understand.
(2) It should be clearly defined by a mathematical formula.
(3) It should not be affected by extreme values.
(4) It should be based on all the observations.
(5) It should be capable of further mathematical treatment.
(6) It should have sample stability.
iii. Write down any two properties of arithmetic mean.
Answer:
(1)The sum of the deviations, of all the values of x, from their arithmetic mean, is zero i.e.
(2) Sum of squares of deviations from arithmetic mean is least i.e.
iv. If mode is 15 and median = 12. Find mean.
Solution:
Mode = 3 Median – 2 Mean
15= 3(12) – 2(Mean)
15 = 36 – 2(Mean)
2(Mean) = 36-15
2(Mean) = 21
Mean = 21/2
Mean = 10.5
v. Find the median of: 0, -1, -4, 3, 5, 10, -3, -7, 10, 3.
Solution:
Array the Data
| S/No | 1 | 2 | 3 | 4 | 5 | 6 | 7 | 8 | 9 | 10 |
| Data | -7 | -4 | -3 | -1 | 0 | 3 | 3 | 5 | 10 | 10 |
vi. Describe four advantages of mode.
Answer:
- It is easy to understand and simple to calculate.
- It is not affected by extreme large or small values.
- It can be located only by inspection in ungrouped data and discrete frequency distribution.
- It can be useful for qualitative data.
- It can be computed in open-end frequency table.
- It can be located graphically.
vii. Contrast between simple and composite index numbers.
Answer:
| Basis | Simple Index Number | Composite Index Number |
| Definition | Measures change in a single item | Measures change in a group of items |
| Data Used | Only one commodity | Multiple commodities combined |
| Purpose | Shows price/quantity change of one good | Shows overall change in a group (e.g., cost of living) |
| Accuracy | Less representative | More representative of real conditions |
| Complexity | Easy to calculate | More complex (may use weights) |
| Examples | Price of wheat over time | Consumer Price Index (CPI) |
viii. Given Σp1qo = 7052, Σpoqo = 6095, Σpoq1 = 6980, Σp1q1 = 8061. Find Fisher Ideal Index.
Solution:
ix. Define consumer price index number.
Answer:
“Consumer Price Index numbers are intended to measure the changes in the prices paid by the consumer for purchasing a specified “basket” of goods and services during the current year as compared to the base year”.
Methods to Calculate
Aggregative Expenditure Method
Household Budget method Or Family Budget Method
SECTION – II (Marks: 16) (2×8=16)
4. (a) Following data represents the reported sales for 26 companies in the shoe industry:
32, 36, 54, 38, 17, 41, 22, 33, 22, 31, 21, 18, 46, 36, 11, 31, 29, 12, 23, 51, 12, 13, 37, 33, 27, 26
Construct a frequency distribution using classes with a width of 10 i.e. 10-20, 20-30 etc.
Solution:
| Class Interval | Frequency |
| 10 – 20 | 6 |
| 20 – 30 | 7 |
| 30 – 40 | 9 |
| 40 – 50 | 2 |
| 50 – 60 | 2 |
| Total | ∑f = 26 |
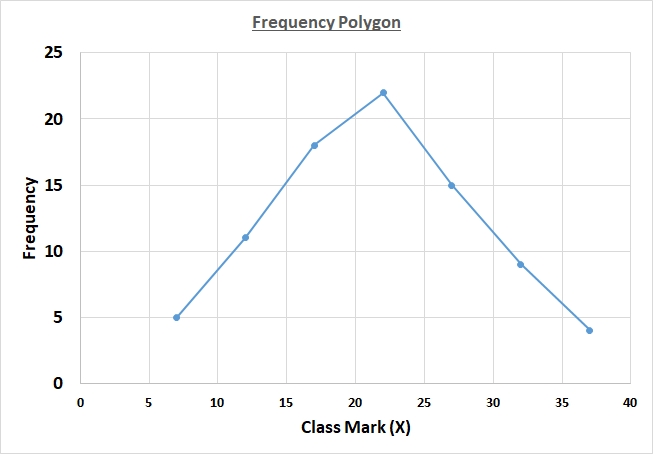
(b) Draw a frequency polygon from the following data:
| C.I. | 5–9 | 10–14 | 15–19 | 20–24 | 25–29 | 30–34 | 35–39 |
| f | 5 | 11 | 18 | 22 | 15 | 9 | 4 |
Solution:
5. (a) For the following data, find arithmetic mean by coding method:
| Marks | 30–39 | 40–49 | 50–59 | 60–69 | 70–79 |
| f | 8 | 87 | 190 | 86 | 20 |
Solution:
| Marks | f | X | D = X-64.5 | U = D/10 | fU |
| 30–39 | 8 | 34.5 | -30 | -3 | -24 |
| 40–49 | 87 | 44.5 | -20 | -2 | -174 |
| 50–59 | 190 | 54.5 | -10 | -1 | -190 |
| 60–69 | 86 | 64.5 | 0 | 0 | 0 |
| 70–79 | 20 | 74.5 | 10 | 1 | 20 |
| ∑f =391 | ∑fU =-368 |
(b) If D = X – 112, calculate median of X from the following data:
| D | -2 | 1 | 0 | 1 | 2 | 3 |
| f | 14 | 30 | 45 | 65 | 72 | 68 |
Solution:
| D | f | fD |
| -2 | 14 | -28 |
| 1 | 30 | 30 |
| 0 | 45 | 0 |
| 1 | 65 | 65 |
| 2 | 72 | 144 |
| 3 | 68 | 204 |
| ∑f = 294 | ∑fD =415 |
6. (a) Given the prices of four commodities. Construct price index numbers by simple average method taking (i) 2016 as base and (ii) average of all year aggregate as base:
| Year | Commodity | |||
| A | B | C | D | |
| 2016 | 81 | 77 | 119 | 55 |
| 2017 | 62 | 54 | 128 | 52 |
| 2018 | 104 | 87 | 111 | 100 |
| 2019 | 93 | 75 | 154 | 96 |
Solution:
(i) 2016 as base
| Year | Commodity Prices & Price Relatives | ||||||||
| A | P.R (A) | B | P.R (B) | C | P.R (C) | D | P.R (D) | Median | |
| 2016 | 81 | (81/81)x100=100 | 77 | (77/77)x100=100 | 119 | (119/119)x100=100 | 55 | (55/55)x100=100 | 100 |
| 2017 | 62 | (62/81)x100=76.54 | 54 | (54/77)x100=70.12 | 128 | (128/119)x100=107.56 | 52 | (52/55)x100=94.54 | (76.54+94.54)/2 = 85.54 |
| 2018 | 104 | (104/81)x100=128.39 | 87 | (87/77)x100=112.98 | 111 | (111/119)x100=93.27 | 100 | (100/55)x100=181.81 | (112.98+128.39)/2 = 120.685 |
| 2019 | 93 | (93/81)x100=114.81 | 75 | (75/77)x100=97.40 | 154 | (154/119)x100=129.41 | 96 | (96/55)x100=174.54 | (114.81+129.41)/2 =122.11 |
(ii) average of all year aggregate as base:
First of all, we have to calculate arithmetic mean for all year prices of commodities:
| Year | Commodity | |||
| A | B | C | D | |
| 2016 | 81 | 77 | 119 | 55 |
| 2017 | 62 | 54 | 128 | 52 |
| 2018 | 104 | 87 | 111 | 100 |
| 2019 | 93 | 75 | 154 | 96 |
| Sum | 340 | 293 | 512 | 303 |
| Average A.M | (340/4) = 85 | (293/4) = 73.25 | (512/4) = 128 | (303/4) = 75.75 |
Now, we are going to calculate price relatives and average of price relatives:
| Year | Commodity Prices & Price Relatives | ||||||||
| A | P.R (A) | B | P.R (B) | C | P.R (C) | D | P.R (D) | Median | |
| 2016 | 81 | (81/85)x100=95.29 | 77 | (77/73.25)x100=105.11 | 119 | (119/128)x100=92.96 | 55 | (55/75.75)x100=72.60 | (92.96+95.29)/2 = 94.125 |
| 2017 | 62 | (62/85)x100=72.94 | 54 | (54/73.25)x100=73.72 | 128 | (128/128)x100=100 | 52 | (52/75.75)x100=68.64 | (72.94+73.72)/2 = 73.33 |
| 2018 | 104 | (104/85)x100=122.35 | 87 | (87/73.25)x100=118.77 | 111 | (111/128)x100=86.71 | 100 | (100/75.75)x100=132 | (118.77+122.35)/2 = 120.56 |
| 2019 | 93 | (93/85)x100=109.41 | 75 | (75/73.25)x100=102.38 | 154 | (154/128)x100=120.31 | 96 | (96/75.75)x100=126.73 | (109.41+120.31)/2 =114.86 |
(b) A fair die is tossed twice. Find the probabilities that the sum of numbers appearing is: (i) At most 5 (ii) At least 10
Solution:
All Possible outcomes or sample points
| 1,1 | 2,1 | 3,1 | 4,1 | 5,1 | 6,1 |
| 1,2 | 2,2 | 3,2 | 4,2 | 5,2 | 6,2 |
| 1,3 | 2,3 | 3,3 | 4,3 | 5,3 | 6,3 |
| 1,4 | 2,4 | 3,4 | 4,4 | 5,4 | 6,4 |
| 1,5 | 2,5 | 3,5 | 4,5 | 5,5 | 6,5 |
| 1,6 | 2,6 | 3,6 | 4,6 | 5,6 | 6,6 |
Sum Table
| 2 | 3 | 4 | 5 | 6 | 7 |
| 3 | 4 | 5 | 6 | 7 | 8 |
| 4 | 5 | 6 | 7 | 8 | 9 |
| 5 | 6 | 7 | 8 | 9 | 10 |
| 6 | 7 | 8 | 9 | 10 | 11 |
| 7 | 8 | 9 | 10 | 11 | 12 |
Events
[2,3,3,4,4,4,5,5,5,5]
[10,10,10,11,11,12]
Probability


