
Solve Statistics II Solved Paper FBISE 2025 2nd Annual FBISE Federal Board with step-by-step solutions. Get past papers, key concepts & exam tips for HSSC-II 2nd Year students.
Are you preparing for the Statistics II exam of FBISE (Federal Board of Intermediate and Secondary Education, Islamabad)? You’ve come to the right place! At BCF Education, we provide complete, step-by-step solutions to the Statistics II past papers for HSSC-II (2nd Year / 12th Class / FSc & ICs Part II) — fully aligned with the Federal Board syllabus and the latest National Curriculum of Pakistan (NCP) 2022–23.
Whether you’re looking for solved annual papers, important questions, short answer preparation, or MCQ practice, our detailed guides are designed to help students from FBISE Islamabad — as well as boards across Punjab, KPK, Sindh, Balochistan, and Azad Kashmir — score maximum marks with confidence.
Explore chapter-wise breakdowns covering key topics such as probability, regression, sampling, hypothesis testing, and index numbers — all explained in simple, easy-to-understand language. Bookmark this page and stay ahead in your Statistics II annual exam 2026!. For other Papers of Statistics Please Visit the following link.
Table of Contents
Statistics II Solved Paper FBISE 2025 2nd Annual
Section – B (Short Questions)
Q.2 Attempt any FOURTEEN parts. All parts carry equal marks. (14 x 3 = 42)
(i) Distinguish between permutations and combinations.
Answer:
Permutation
In permutation, order of the elements matters. For example, if there is a specific number 256, which means strictly 256, neither 526 nor 652. Permutation is used when order of the items is important. In mathematics permutation can be calculated through following formula:
Combination
In combination, order of the elements does not matter. For example, if there is one basket containing apples, bananas and oranges, no matter what comes first either banana, apples, oranges or oranges, bananas and apples etc. Combination is used when order of the elements is not important. Formula for combination is:
(ii) If A and B are independent events with P(A) = 0.2 and P(B) = 0.6. Find P(A∪B).
Answer:
P(A∪B) = P(A)+P(B)−P(A)P(B) = 0.2+0.6−0.12 = 0.68.
(iii) In a given population 470 male births are registered in 1000 births. What is the probability of the next female birth?
Answer:
(iv) Given E(X) = 0.55, var(X) = 1.55, and Y = 2X + 1. Find E(Y) and var(Y).
Solution:
E(Y) = 2E(X) + 1
E(Y) = 2×0.55 + 1 = 1.1 + 1 = 2.1
Var(Y) = 2²Var(X) + Var(1)
Var(Y) = 4 (1.55) + 0 = 6.2
(v) Describe the properties of a discrete probability distribution.
Answer:
1. Each probability is between 0 and 1
Every single probability is never less than 0 and never more than 1.
0 ≤ P(x) ≤ 1
2. The sum of all probabilities is exactly 1
If you add up the probabilities of all possible outcomes, the total will always be 1.
ΣP(x) = 1
3. Each outcome is separate (mutually exclusive)
No two outcomes can happen at the same time.
Example: When you toss a coin, you cannot get both Head and Tail together.
4. The distribution covers all possible outcomes
The list of probabilities includes every possible value that the random variable can take. Nothing is left out.
(vi) A random variable X is binomially distributed with mean 3 and variance 2.
Compute P (X = 6).
Answer:
(vii) In a binomial distribution with n = 5, P(X = 0) = P(X = 1). Find the variance.
Solution
Here n = 5 and P(X=0) = P(X=1). Therefore
If P(x = 0) = P(x = 1) then:
(viii) 1st and 3rd quartiles of the normal distribution are 9 and 18, respectively. Find the mean and standard deviation of the distribution.
Solution:
Q3−Q1 = 0.6745σ × 2
18-9 = 1.349σ
9 = 1.349σ
σ = 9/1.349 = 6.67
Mean = Q3 − 0.6745σ
Mean = 18 – 0.6745(6.67)
Mean = 18 – 4.498915
Mean = 13.5
(ix) The value of the second moment about the mean in a normal distribution is 5. Find the third and fourth moments about the mean for this distribution.
Answer:
(x) Differentiate between probability and non-probability sampling.
Answer:
Probability Sampling vs. Non-Probability Sampling
| Basis | Probability Sampling | Non-Probability Sampling |
| Meaning | Every member of the population has a known and equal chance of being selected. | Members are chosen based on the researcher’s judgment or convenience, not by random chance. |
| Random Selection | Yes, random method is used (like lottery or random number table). | No, random method is not used. |
| Chance of Selection | Known and equal for everyone. | Unknown and not equal. |
| Bias | Very little or no bias. | High chance of bias. |
| Representation | The sample truly represents the whole population. | The sample may not represent the population well. |
| Accuracy of Results | Results are more accurate and reliable. | Results are less accurate and may be misleading. |
| Cost and Time | More expensive and time-consuming. | Less expensive and quicker. |
| Examples | Simple random sampling, stratified sampling, systematic sampling. | Convenience sampling, purposive sampling, quota sampling, snowball sampling. |
(xi) Given N = 310, n = 100, σ² = 35. Find σ²ₓ when sampling is done without replacement.
Solution:
(xii) Find population mean and variance if samples of size 2 with replacement give mean and variance as 10 and 2.5, respectively.
Solution:
(xiii) What is an unbiased estimator?
Answer:
An unbiased estimator is a formula or rule that gives a correct estimate of a population value on average. It does not consistently overestimate or underestimate the true value. An unbiased estimator is a statistic whose expected value is equal to the true population parameter.
(xiv) Given X̄ = 120, µo = 100, n = 25, and s = 34.75. Find the value of t.
Solution:
(xv) What is meant by a contingency table?
Answer:
A contingency table (also called a cross-tabulation or crosstab) is a table that shows how two categorical variables are related. It displays the number of items or people that fall into each possible combination of categories. This table helps us understand whether the two variables are associated (linked) or independent (not linked).
(xvi) Given the following information (α) = 54, (αβ) = 16, (β) = 490, N = 1000. Show whether attributes A and B are positively associated, negatively associated, or independent.
Solution:
(αβ) = 16, (α) = 54, (β) = 490, N = 1000
Negative Association
(xvii) Given X̄ = 42.7, σ = 8, n = 64, and Z(α/2) = 1.645. Find the confidence interval for μ.
Solution: (Large Samples where n > 30) (With Replacement)
(xviii) Distinguish between simple and composite hypotheses.
Answer:
Simple Hypothesis
A simple hypothesis is one in which all parameters of the distribution are specified. A simple hypothesis specifies the exact value of a population parameter.
Composite Hypothesis
A hypothesis which is not simple (i.e. in which not all of the parameters are specified) is called a composite hypothesis. A composite hypothesis specifies a range or set of values for a parameter.
(xix) Differentiate between RAM and ROM.
Answer:
RAM (Random Access Memory)
RAM (Random Access Memory) is a temporary and volatile type of computer memory that stores data and programs currently in use. It allows the computer to access and process information quickly, which makes it very fast and essential for running applications. However, the data stored in RAM is lost when the computer is turned off. Therefore, RAM is mainly used for short-term operations and improving system performance.
ROM (Read Only Memory)
ROM (Read Only Memory) is a permanent and non-volatile type of memory that stores important instructions required to start and operate a computer, such as booting programs. Unlike RAM, the data in ROM is not lost when the power is switched off. It is slower than RAM but plays a crucial role in maintaining essential system functions.
Section – C (Long Questions)
Q.3 a. The probability that Mr. A will pass the examination is 2/3 and that Mr. B will pass is 3/4. Find the probabilities that: (i) both will pass the examination, (ii) at least one will pass the examination, and (iii) somebody will pass the examination.
Solution:
a. Given:
Assuming independence.
(i) Both will pass:
(ii) At least one will pass:
(iii) Somebody will pass:
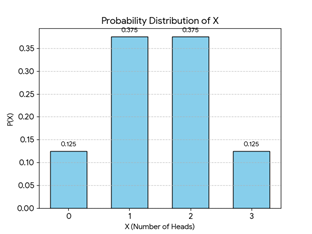
b. Three coins are tossed. If X denotes the number of heads, then find the probability distribution of X. Calculate the mean, variance, and graph of the probability distribution.
Solution b.
Three coins tossed, X = number of heads
Sample space: HHH, HHT, HTH, THH, HTT, THT, TTH, TTT.
| X | Outcomes | P(X) | xp(x) | x²p(x) |
| 0 | TTT | 1/8 | 0 | 0 |
| 1 | HTT, THT, TTH | 3/8 | 3/8 | 3/8 |
| 2 | HHT, HTH, THH | 3/8 | 6/8 | 12/8 |
| 3 | HHH | 1/8 | 3/8 | 9/8 |
| ∑ xp(x)=12/8 | ∑ x²p(x)=24/8 |
Mean E(X) = ∑ xp(x) = 12/8
Mean E(X) = 1.5
Var(x) = ∑ x²p(x) – [∑ xp(x)]²
Var(x) = 24/8 – (1.5)²
Var(x) = 3-2.25
Var(x) = 0.75
Graph of Probability Distribution
Q.4 a. In a normal distribution, μ = 300 and σ² = 100. Find (i) the area above 314, (ii) the two values that contain the middle 75% area, and (iii) Q1 and Q3.
Solution a:
Normal distribution, μ=300, σ²=100 → σ=10
(i) Area above 314:
Area above 1.4 = 1 – 0.9192 = 0.0808 (using z-table).
(ii) Middle 75% area:
Middle 75% means 12.5% in each tail.
z for 0.125 tail → z ≈ 1.15 (since 0.125 corresponds to ~1.15 from inverse table).
Values: 300±1.15×10=300±11.5 → 288.5 to 311.5.
(iii) Q1 and Q3:
Q1 is 25th percentile → z ≈ -0.675.
Q3 is 75th percentile → z ≈ +0.675.
Q1=300+(−0.675) (10) =293.25
Q3=300+(0.675) (10) =306.75
b. A population has seven values 2, 3, 4, 5, 7, 8, 10. Draw all possible samples of size 2 without replacement. Find the mean of each sample. Construct the sampling distribution of sample means and verify that:
Solution b:
Population = 2, 3, 4, 5, 7, 8, 10
Population Size N = 7
Sample size n = 2
| S/No | Samples | Sum of Samples | Mean of Samples | S/No | Samples | Sum of Samples | Mean of Samples |
| 1 | 2,3 | 5 | 2.5 | 12 | 4,5 | 9 | 4.5 |
| 2 | 2,4 | 6 | 3 | 13 | 4,7 | 11 | 5.5 |
| 3 | 2,5 | 7 | 3.5 | 14 | 4,8 | 12 | 6 |
| 4 | 2,7 | 9 | 4.5 | 15 | 4,10 | 14 | 7 |
| 5 | 2,8 | 10 | 5 | 16 | 5,7 | 12 | 6 |
| 6 | 2,10 | 12 | 6 | 17 | 5,8 | 13 | 6.5 |
| 7 | 3,4 | 7 | 3.5 | 18 | 5,10 | 15 | 7.5 |
| 8 | 3,5 | 8 | 4 | 19 | 7,8 | 15 | 7.5 |
| 9 | 3,7 | 10 | 5 | 20 | 7,10 | 17 | 8.5 |
| 10 | 3,8 | 11 | 5.5 | 21 | 8,10 | 18 | 9 |
| 11 | 3,10 | 13 | 6.5 |
| (a) Sampling Distribution of X̅ | |||
| X̅ | f | fX̅ | fX̅² |
| 2.5 | 1 | 2.5 | 6.25 |
| 3 | 1 | 3 | 9 |
| 3.5 | 2 | 7 | 24.5 |
| 4 | 1 | 4 | 16 |
| 4.5 | 2 | 9 | 40.5 |
| 5 | 2 | 10 | 50 |
| 5.5 | 2 | 11 | 60.5 |
| 6 | 3 | 18 | 108 |
| 6.5 | 2 | 13 | 84.5 |
| 7 | 1 | 7 | 49 |
| 7.5 | 2 | 15 | 112.5 |
| 8.5 | 1 | 8.5 | 72.25 |
| 9 | 1 | 9 | 81 |
| 21 | 117 | 714 | |
| ∑f = | ∑fX̅ = | ∑fX̅²= | |
Calculation of Sample Statistic
Mean, Variance & S.D of Sampling Distribution
Calculation of Population Parameter
| X | X² |
| 2 | 4 |
| 3 | 9 |
| 4 | 16 |
| 5 | 25 |
| 7 | 49 |
| 8 | 64 |
| 10 | 100 |
| ∑X=39 | ∑X²=267 |
Verification
Q.5 a. 150 brand A light bulbs showed a mean lifetime of 1400 hours with a standard deviation of 120 hours. A sample of 200 brand B light bulbs showed a mean lifetime of 1200 hours with a standard deviation of 80 hours. Find (i) 95% and (ii) 99% confidence limits for the difference of the mean lifetimes of populations of brands A and B. (Z₀.₀₂₅ = 1.96, Z₀.₀₀₁ = 2.58)
Solution:
Data:
Confidence Interval at 95%
Confidence Interval at 99%
b. The following table shows the likings of three colors pink, white, and blue in a sample of 200 males and females. Test whether there is any relation between gender and color at a 5% level of significance (χ²₀.₀₅(2) = 5.991).
| Colors | Male | Female | Total |
| Pink | 20 | 40 | 60 |
| White | 40 | 20 | 60 |
| Blue | 60 | 20 | 80 |
| Total | 120 | 80 | 200 |
Solution:
Step 1 Testing the Hypothesis
Ho: There is no Association between Colors & Gender.
H1: There is Association between Colors & Gender.
Step 2 Level of Significance
Level of Significance = α=0.05
Step 3 Test Statistic
Step 4 Critical Region
Critical Region: Degree of Freedom d.f= (R-1)(C-1)
So d.f= (3-1)(2-1)=2
The Value of Tabulated χ²(0.05,2)=5.991
The Critical Region χ²cal>5.991
Step 5 Calculation of Expected Frequencies
Step 6 Calculation of χ²:
| Table Computation of χ² | ||||
| fo | fe | fo-fe | (fo-fe)² | [(fo-fe)²/fe] |
| 20 | 36 | -16 | 256 | 7.11 |
| 40 | 24 | 16 | 256 | 10.67 |
| 40 | 36 | 4 | 16 | 0.44 |
| 20 | 24 | -4 | 16 | 0.67 |
| 60 | 48 | 12 | 144 | 3.00 |
| 20 | 32 | -12 | 144 | 4.50 |
| ∑[(fo-fe)²/fe] = 26.39 | ||||
Step 7 Conclusion
The calculated value of χ² is 26.39 is more than the tabulated value of χ² 5.991 or 26.39 falls in the rejection region. We reject the Null Hypothesis Ho, accepts alternative hypothesis H1 and conclude that there is association between Colors & Gender.


