Focused Questions, Theory of Costs and Revenues. This blog post focuses on the important questions and key concepts of the Theory of Cost and Revenue in economics. It covers essential topics such as types of costs and revenues, short-run and long-run cost curves, economies and diseconomies of scale, and the relationship between cost, revenue, and profit. Ideal for students of economics, business, and finance preparing for exams or building conceptual clarity.
This topic is equally important for the students of economics across all the major Boards and Universities such as FBISE, BISERWP, BISELHR, MU, DU, PU, NCERT, CBSE & others & across all the business & finance disciplines.
Table of Contents
Focused Questions, Theory of Costs and Revenue
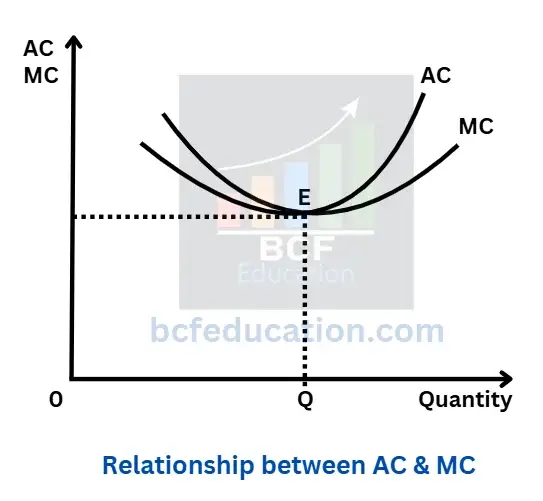
Explain the relationship between Average Cost and Marginal Cost with the help of a diagram
Answer:
- Average Cost and Marginal Cost both derive from Total Cost.
- When average Cost falls, marginal Cost remains below the average cost.
- When average cost rises, marginal cost remains above the average cost.
- Marginal Cost curve intersects average cost curve at the least point of average cost.
Diagram
Differentiate between Fixed Cost and Variable Cost.
Answer:
Fixed Cost
Fixed cost is component of total cost which is independent to number of units of output such as factory rent, salaries of the staff etc.
Variable Cost
Variable cost is a component of total cost which is dependent to number of unit of output such as raw material, machine fuel etc.
What is Average Fixed Cost (AFC). How can Average Fixed Cost (AFC) be calculated?
Answer:
Average Fixed Cost AFC is an average of fixed cost which can be calculated through fixed cost divided by number of units. Formula for average fixed cost is given below:
![\[ \mathbf{AFC =}\frac{\mathbf{Fixed\ CostFC}}{\mathbf{Number\ of\ Units\ Q}}\ \]](https://bcfeducation.com/wp-content/ql-cache/quicklatex.com-fdcdd0d49d6744497dd88a57a8611c85_l3.png "Rendered by QuickLaTeX.com")
What is meant by the total revenue? Given an example.
Total Revenue (TR) is the total income a firm earns from selling its goods or services, calculated as the price per unit multiplied by the quantity sold.
Example: If a company sells 100 units of a product at $10 each, the total revenue is:
![\[ TR = Price \times Quantity = 10 \times 100 = 1000\ \]](https://bcfeducation.com/wp-content/ql-cache/quicklatex.com-6b586da163e7a093e1edd40462e19842_l3.png "Rendered by QuickLaTeX.com")
Define average cost, what is the need to calculate average cost? Also give the formula for its calculation.
Answer:
Average Cost (AC) is the total cost of production divided by the quantity of output produced. It represents the cost per unit of output. It helps producers to determine cost efficiency and profitability.
Formula:
![\[ Average\ Cost\ (AC) = \frac{Total\ Cost\ (TC)}{Quantity\ (Q)}\ \]](https://bcfeducation.com/wp-content/ql-cache/quicklatex.com-4560b1a322aa1112452a2a1308f26854_l3.png "Rendered by QuickLaTeX.com")
Define Marginal Cost. How it can be found?
Answer:
Marginal Cost (MC) is the additional cost incurred by producing one more unit of a good or service. It reflects the change in total cost when output is increased by a single unit. It can be calculated by dividing change in total cost and change in quantity demand. Its formula is given below:
![\[ M.C = \frac{\mathrm{\Delta}TC}{\mathrm{\Delta}Q}\ \]](https://bcfeducation.com/wp-content/ql-cache/quicklatex.com-df99318ebcfaa331d3ae1a6089959718_l3.png "Rendered by QuickLaTeX.com")
If total cost function is known, it can be calculated through taking the derivative of total cost function.
![\[ M.C = \frac{dTC}{dQ}\ \]](https://bcfeducation.com/wp-content/ql-cache/quicklatex.com-f21bdac55ebadbeffd48077c20469ddb_l3.png "Rendered by QuickLaTeX.com")
Reproduce and complete the following table on the answer sheet:
| a | Total Revenue (TR) | Average Revenue (AR) | Marginal Revenue (MR) |
| 0 | 0 | 0 | 0 |
| 1 | 4 | 4 | |
| 2 | 6 | 3 | |
| 3 | 6 | 2 | |
| 4 | 4 | 1 |
Solution:
| a | Total Revenue (TR) | Average Revenue (AR) | Marginal Revenue (MR) |
| 0 | 0 | 0 | 0 |
| 1 | 4 | 4 | 4 |
| 2 | 6 | 3 | 2 |
| 3 | 6 | 2 | 0 |
| 4 | 4 | 1 | -2 |
Define Total Fixed Cost.
Answer:
Total fixed cost is the sum or total of fixed cost where, Fixed cost is component of total cost which is independent to number of units of output such as factory rent, salaries of the staff etc.
Define marginal Revenue (MR) of a firm. Write it mathematically.
Answer:
Marginal Revenue (MR) is the additional revenue a firm earns from selling one more unit of a good or service. It represents the change in total revenue when output is increased by a single unit. It can be calculated by dividing change in total revenue and change in quantity. Formula is given below:
![\[ M.R = \frac{\mathrm{\Delta}TR}{\mathrm{\Delta}Q}\ \]](https://bcfeducation.com/wp-content/ql-cache/quicklatex.com-ee07235e2989aab1234945ae1f9697b3_l3.png "Rendered by QuickLaTeX.com")
If total revenue function is known, it can be calculated through taking the derivative of total revenue function.
![\[ M.R = \frac{dTR}{dQ}\ \]](https://bcfeducation.com/wp-content/ql-cache/quicklatex.com-a795ecb36f16475c383975e1c48d3f8c_l3.png "Rendered by QuickLaTeX.com")
Define Marginal Cost (MC) and Marginal Revenue (MR).
Answer:
Marginal Cost (MC) is the additional cost incurred by producing one more unit of a good or service. It reflects the change in total cost when output is increased by a single unit. It can be calculated by dividing change in total cost and change in quantity demand. Its formula is given below:
If total cost function is known, it can be calculated through taking the derivative of total cost function.
Marginal Revenue (MR) is the additional revenue a firm earns from selling one more unit of a good or service. It represents the change in total revenue when output is increased by a single unit. It can be calculated by dividing change in total revenue and change in quantity. Formula is given below:
If total revenue function is known, it can be calculated through taking the derivative of total revenue function.
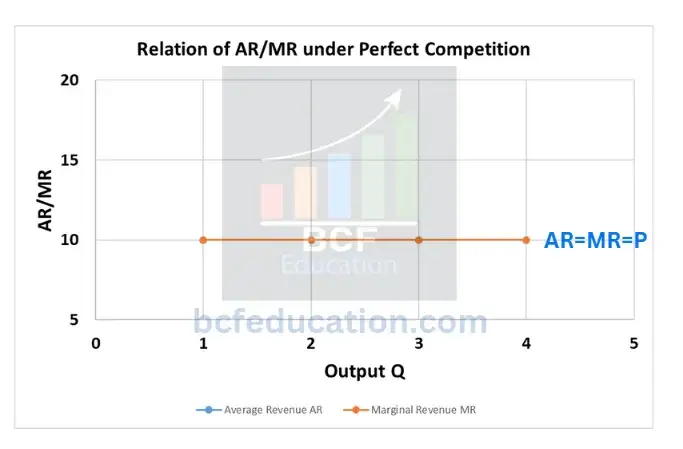
Show the average revenue (AR) and marginal revenue (MR) curves under perfect competition in a diagram and briefly explain its relationship.
Answer: Under perfect competition, average revenue AR and marginal revenue MR curves are identical, horizontal and equal to price because under perfect competition, firms are price taker and they cannot influence the market. For more clarity, follow the table and diagram below:
| Price | Output Q | Total Revenue TR | Average Revenue AR | Marginal Revenue MR |
| 10 | 1 | 10 | 10 | 10 |
| 10 | 2 | 20 | 10 | 10 |
| 10 | 3 | 30 | 10 | 10 |
| 10 | 4 | 40 | 10 | 10 |
Briefly explain the concept of opportunity cost with the help of an example.
Answer:
Opportunity Cost
Opportunity Cost is a fundamental concept of economics. It is the value of next alternative which is forgone while making a choice or it is the value of alternative which you give up. For example, you have two options:
Option A: You spend Rs. 100 to buy a ticket for a movie for your amusement.
Option B: You invest Rs. 100 into stocks.
If you chose option B, your opportunity cost is amusement or enjoyment and if you chose option A, your opportunity cost is Rs. 10 possible return on Rs. 100
The table gives data about the total cost of production at different levels of output. Reproduce the table on your answer book and fill in the total variable cost (TVC) Column:
| Output | TC | TVC |
| 0 | 2000 | |
| 1 | 2200 | |
| 2 | 2350 | |
| 3 | 2750 |
Answer:
| Output | TC | TVC |
| 0 | 2000 | 0 |
| 1 | 2200 | 200 |
| 2 | 2350 | 350 |
| 3 | 2750 | 750 |
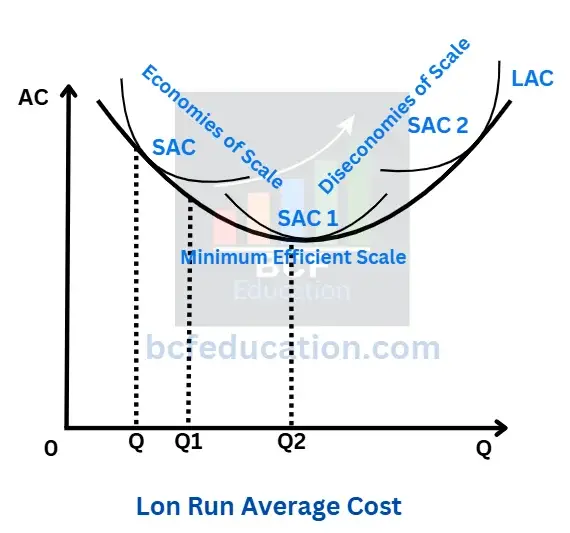
Why is the average cost curve U-shaped? Or Define envelope/planning curve.
Answer:
Long Run Average Cost curve is U-shaped. It is also called envelope curve or planning curve. It is U-shaped because of economies and diseconomies of scale.
Economies of Scale
Economies of scale means fall in average cost due to larger spread of fixed cost, efficiency and division of labour for large output and Bulk purchase.
Diseconomies of Scale
Diseconomies of scale means average cost rises after minimum efficient scale due to inefficient management, overcrowding of resources, communication problem and bureaucracy etc.
Diagram
Complete the table:
| Quantity | TFC | TVC | TC | MC |
| 0 | 40 | – | 40 | – |
| 1 | 40 | 20 | 60 | 20 |
| 2 | – | – | – | 15 |
| 3 | – | – | – | 12 |
| 4 | – | – | 103 | 16 |
Answer:
| Quantity | TFC | TVC | TC | MC |
| 0 | 40 | 0 | 40 | 40 |
| 1 | 40 | 20 | 60 | 20 |
| 2 | 40 | 35 | 75 | 15 |
| 3 | 40 | 47 | 87 | 12 |
| 4 | 40 | 63 | 103 | 16 |
Reproduce and complete the following table on your answer book:
| Quantity (Q) | 1 | 2 | 3 | 4 | 5 | 6 |
| Price (P) | 8 | 7 | 6 | 5 | 4 | 3 |
| Total Revenue (TR) | 8 | 14 | 18 | 20 | – | 18 |
| Average Revenue (AR) | 7 | – | 5 | 4 | 3 | |
| Marginal Revenue (MR) | 8 | – | 4 | 2 | 0 | – |
Answer:
| Quantity (Q) | 1 | 2 | 3 | 4 | 5 | 6 |
| Price (P) | 8 | 7 | 6 | 5 | 4 | 3 |
| Total Revenue (TR) | 8 | 14 | 18 | 20 | 20 | 18 |
| Average Revenue (AR) | 7 | 7 | 5 | 4 | 3 | 3 |
| Marginal Revenue (MR) | 8 | 6 | 4 | 2 | 0 | -2 |
Reproduce the following table on your answer sheet and complete it:
| Quantity | TFC | TVC | TC | MC |
| 0 | 10 | – | 10 | – |
| 1 | – | – | 25 | – |
| 2 | – | – | 35 | – |
| 3 | – | – | 40 | 5 |
Answer:
| Quantity | TFC | TVC | TC | MC |
| 0 | 10 | 0 | 10 | 10 |
| 1 | 10 | 15 | 25 | 15 |
| 2 | 10 | 25 | 35 | 10 |
| 3 | 10 | 30 | 40 | 5 |
Define short and long run.
Answer:
Short Run
In economics, short run is a time period in which at-least one input is fixed. Under short run there are fixed and variable costs in the production. Under short run, production capacity remains low.
Long Run
In economics, long run is a time period in which all factors are variable. Under long run there is only variable costs in the production. Under long run, production capacity turns high.
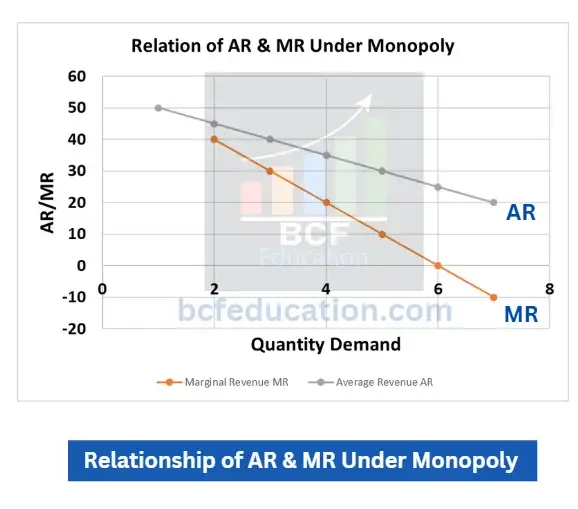
Draw Average Revenue (AR) and Marginal Revenue (MR) curves under monopoly.
Answer:
Table
| Q.D | Price P | Total Revenue TR | Average Revenue AR | Marginal Revenue MR |
| 1 | 50 | 50 | 50 | 0 |
| 2 | 45 | 90 | 45 | 40 |
| 3 | 40 | 120 | 40 | 30 |
| 4 | 35 | 140 | 35 | 20 |
| 5 | 30 | 150 | 30 | 10 |
| 6 | 25 | 150 | 25 | 0 |
| 7 | 20 | 140 | 20 | -10 |
Diagram
What is meant by internal economies of scale?
Answer:
Internal economies of scale are the cost savings a company experiences as it grows and produces more. These savings come from improvements that happen inside the company itself. For example, as a firm gets bigger, it can have workers and machines focus on specific tasks, boosting efficiency. It might also invest in advanced technology that works best when used at a large volume.
Additionally, bigger companies can often borrow money at lower interest rates and negotiate discounts when buying materials in bulk. All these advantages reduce the average cost of producing each unit, making the company more competitive. Importantly, these benefits are managed internally and are unique to each growing business.
What is meant by internal diseconomies of scale.
Answer:
Internal diseconomies of scale happen when a company grows too big and starts to face rising costs instead of saving money. These increased costs come from problems inside the company, such as management struggling with slow decision-making or poor communication. As the organization becomes more complex, different departments may have trouble coordinating with each other.
Moreover, when the workforce is very large, employees may feel less connected and less motivated, which can hurt productivity. All of these issues make it more expensive for the company to produce each unit, reducing its overall efficiency.
Define cost of production.
Answer:
Cost of production is the total amount a business spends to make a certain quantity of goods or services. This includes the cost of raw materials and wages, which can change depending on how much is produced. It also covers fixed expenses like rent, interest, and salaries that stay the same regardless of production levels. In short, it’s all the money a company spends on materials, labor, equipment, and overhead to run its operations.
What is meant by implicit cost?
Answer:
Implicit cost is the value of what a company gives up when it uses its own resources instead of renting or selling them to others. Even though no money changes hands, this cost reflects the missed opportunities. For example, if a business owner works in their own company, the implicit cost is the salary they could have earned elsewhere. Similarly, if the company uses a building it owns, the implicit cost is the rent it could have earned by leasing that space. Essentially, implicit costs represent the hidden trade-offs of using your own resources.
What is meant by explicit cost?
Answer:
Explicit cost is the actual money a company spends to buy goods and services from others. These are clear, out-of-pocket expenses that show up in the company’s financial records. Examples include paying employees’ wages, rent for a factory, buying raw materials, and paying utility bills. In short, explicit costs are the real cash payments a business makes to keep running.
Write down cost and revenue function.
Answer:
Cost Function
The total cost (TC) of producing a quantity Q is given by:
TC = FC + VC(Q)
TC: Total Cost
FC: Fixed Costs (constant, do not vary with output, e.g., rent)
VC(Q): Variable Costs (a function of output Q, e.g., raw materials)
A common simplified form is the linear cost function:
TC = a + bQ
where ‘a’ is Fixed Cost (FC) and ‘bQ’ is Variable Cost (VC).
Revenue Function
The total revenue (TR) from selling a quantity Q is given by:
TR = P × Q
TR: Total Revenue
P: Price per unit
Q: Quantity sold
If the price is constant, this is a simple linear function. If the firm faces a downward-sloping demand curve, price is also a function of quantity, P(Q), making the revenue function:
TR = P(Q) × Q
Related Posts
Evolving different thoughts of Economics
2.1 Theory of Consumer Behaviour
2.2 Total Utility, Marginal Utility, Point of Satiety & Types of Utilities
2.3 The Law of Diminishing Marginal Utility DMU
2.4 The Law of Equal Marginal Utility EMU
3.1 Demand, Individual Demand, Aggregate Demand, Law of Demand
3.2 Change and Shift in Demand, Extension and Contraction in Demand, Rise and Fall in Demand
3.4 Point and Arc Elasticity of Demand
3.5 Income Elasticity of Demand, Cross Elasticity of Demand
4.2 Extension and Contraction, Rise and Fall in Supply