
In this blog post, we are going to discuss that What is Equilibrium of demand and supply, Market Equilibrium. It is the point where the quantity demanded by consumers matches the quantity supplied by producers at a specific price. At this point, the market is in balance—there is no shortage or surplus of goods, and prices remain stable. Understanding this concept is vital in economics as it explains how prices are determined in a free market and how changes in demand or supply can shift the equilibrium.
This topic is equally important for the students of economics across all the major Boards and Universities such as FBISE, BISERWP, BISELHR, MU, DU, PU, NCERT, CBSE & others & across all the business & finance disciplines.
Table of Contents
What is Equilibrium of Demand and Supply, Market Equilibrium
Equilibrium of Demand and Supply or Market equilibrium is the point at which quantity demanded by the consumer meets the quantity supply by the producer in the market or simply we can say that it is the point at which quantity demanded intersects quantity supplied. The price and quantity at which, it intersects is called equilibrium price and equilibrium quantity.
Key Characteristics of Equilibrium:
- Demand equals Supply: At equilibrium, the quantity demanded (Qd) equals the quantity supplied (Qs), i.e., Qd = Qs.
- No Surplus or Shortage: There is no excess supply (surplus) or excess demand (shortage) in the market.
- Stable Price: The equilibrium price remains stable unless there is a shift in demand or supply.
Assumptions of Demand and Supply Equilibrium:
- Perfect Competition: It is assumed that that there is perfect competition in the market which means there are enough buyers and sellers in the market and nobody can influence the price in the market.
- Ceteris Paribus: All other factors affecting demand and supply (e.g., consumer preferences, income, technology, etc.) remain constant.
- Rational Behavior: It is also assumed that buyers and sellers act rationally, aiming to maximize utility and profit, respectively.
- Homogeneous Products: The goods or services traded in the market are identical, with no differentiation.
- Free Entry and Exit: Firms can freely enter or exit the market without barriers.
- Perfect Information: Buyers and sellers have complete information about market conditions, prices, and product quality.
- No External Interventions: There are no government interventions (e.g., price controls, taxes, or subsidies) affecting the market.
Tabulated and Graphical Presentation
Table 4.4 Equilibrium of Quantity Demand & Supply
| Price | Quantity Demand Q.D | Quantity Supply Q.S |
| 100 | 10 | 2 |
| 200 | 8 | 4 |
| 300 | 6 | 6 |
| 400 | 4 | 8 |
| 500 | 2 | 10 |
Figure 4.4 Equilibrium of Quantity Demand & Supply
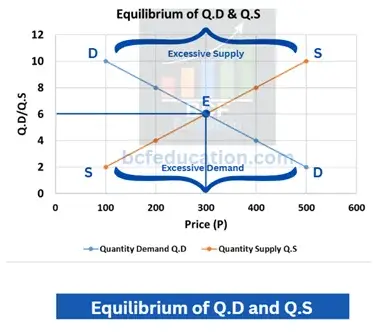
Explanation
- In above diagram, price is given on x-axis.
- Quantity demand and quantity supply is given on y-axis.
- Positively moving upward line is supply line showing positive relation between price and supply.
- Negatively sloping downward line is showing demand line showing negative relation between price and demand.
- E is the equilibrium point at which market is in equilibrium.
- Beyond the point E there is an excessive supply in the market.
- Below the point E there is an excessive demand in the market.
- Quantity Demand and Supply 6 and Price 300 is equilibrium quantity demand, supply and price.
As at the price of 10, Quantity demand is 10 units and quantity supply is 2. When price increase to 200, quantity demand declines to 8 and quantity supply turns 4 because of negative relation between price and quantity demand and positive relation between price and quantity supply. When price rises more to 300, quantity demand and supply both turns 6 which is the equilibrium point. So 300 is the equilibrium price and 6 is equilibrium quantity of demand and supply at which the market is in equilibrium.
Related Posts
Evolving different thoughts of Economics
2.1 Theory of Consumer Behaviour
2.2 Total Utility, Marginal Utility, Point of Satiety & Types of Utilities
2.3 The Law of Diminishing Marginal Utility DMU
2.4 The Law of Equal Marginal Utility EMU
3.1 Demand, Individual Demand, Aggregate Demand, Law of Demand
3.2 Change and Shift in Demand, Extension and Contraction in Demand, Rise and Fall in Demand
3.4 Point and Arc Elasticity of Demand
3.5 Income Elasticity of Demand, Cross Elasticity of Demand
4.2 Extension and Contraction, Rise and Fall in Supply